Cherokee vs Hungarian Householder Income Over 65 years
COMPARE
Cherokee
Hungarian
Householder Income Over 65 years
Householder Income Over 65 years Comparison
Cherokee
Hungarians
$54,133
HOUSEHOLDER INCOME OVER 65 YEARS
0.1/ 100
METRIC RATING
275th/ 347
METRIC RANK
$61,673
HOUSEHOLDER INCOME OVER 65 YEARS
67.7/ 100
METRIC RATING
151st/ 347
METRIC RANK
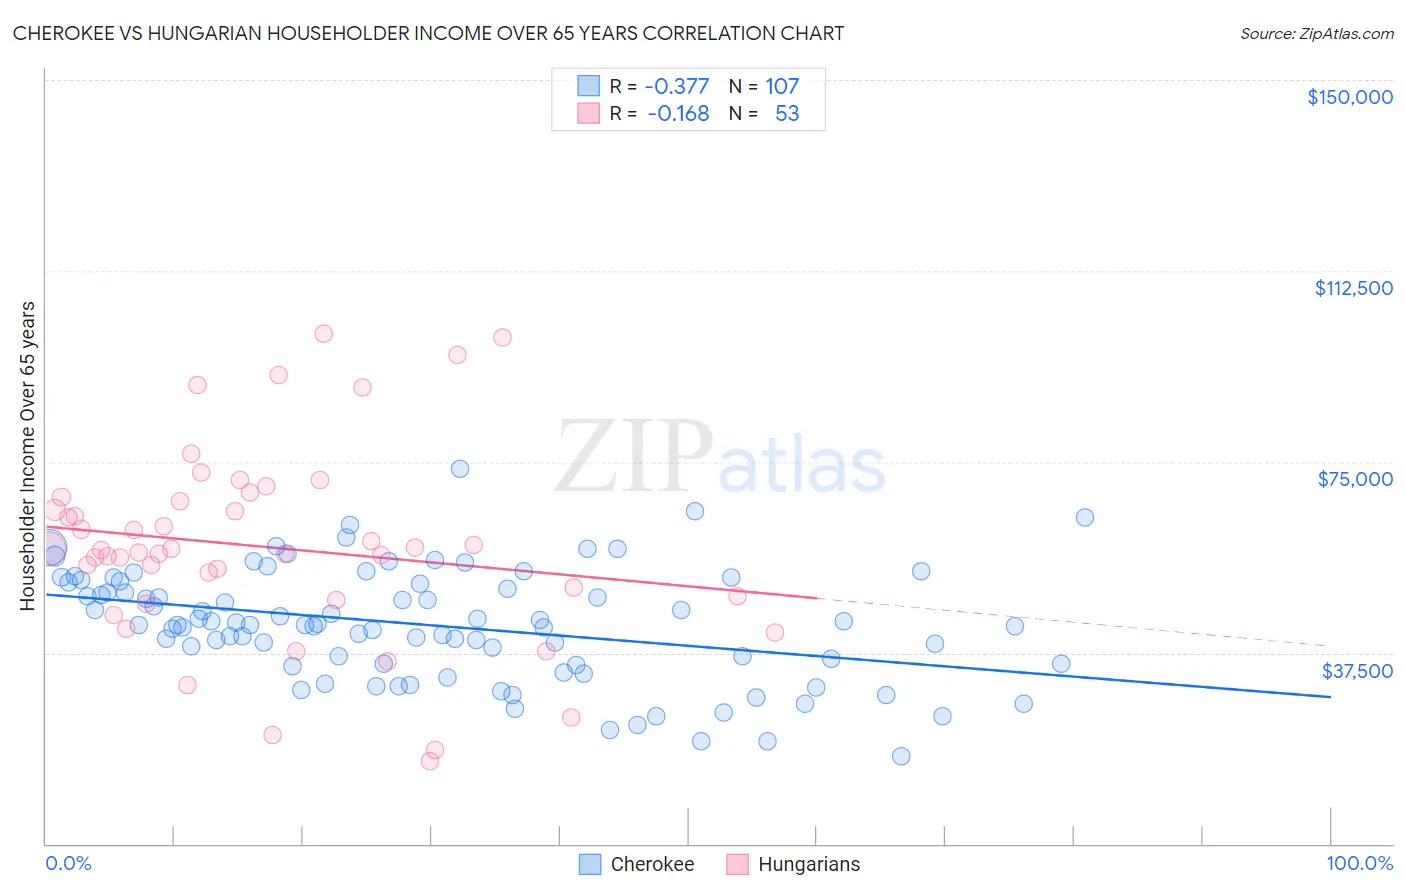
Cherokee vs Hungarian Householder Income Over 65 years Correlation Chart
The statistical analysis conducted on geographies consisting of 490,908,183 people shows a mild negative correlation between the proportion of Cherokee and household income with householder over the age of 65 in the United States with a correlation coefficient (R) of -0.377 and weighted average of $54,133. Similarly, the statistical analysis conducted on geographies consisting of 483,949,327 people shows a poor negative correlation between the proportion of Hungarians and household income with householder over the age of 65 in the United States with a correlation coefficient (R) of -0.168 and weighted average of $61,673, a difference of 13.9%.
Householder Income Over 65 years Correlation Summary
| Measurement | Cherokee | Hungarian |
| Minimum | $17,188 | $16,250 |
| Maximum | $73,750 | $100,190 |
| Range | $56,562 | $83,940 |
| Mean | $42,917 | $58,276 |
| Median | $42,899 | $57,812 |
| Interquartile 25% (IQ1) | $35,369 | $48,254 |
| Interquartile 75% (IQ3) | $51,355 | $67,733 |
| Interquartile Range (IQR) | $15,986 | $19,479 |
| Standard Deviation (Sample) | $10,957 | $18,944 |
| Standard Deviation (Population) | $10,906 | $18,765 |
Similar Demographics by Householder Income Over 65 years
Demographics Similar to Cherokee by Householder Income Over 65 years
In terms of householder income over 65 years, the demographic groups most similar to Cherokee are Cree ($54,129, a difference of 0.010%), Barbadian ($54,163, a difference of 0.060%), Cheyenne ($54,096, a difference of 0.070%), Indonesian ($54,176, a difference of 0.080%), and Potawatomi ($54,212, a difference of 0.15%).
| Demographics | Rating | Rank | Householder Income Over 65 years |
| Immigrants | Zaire | 0.1 /100 | #268 | Tragic $54,512 |
| Nicaraguans | 0.1 /100 | #269 | Tragic $54,474 |
| Immigrants | Senegal | 0.1 /100 | #270 | Tragic $54,447 |
| Liberians | 0.1 /100 | #271 | Tragic $54,356 |
| Potawatomi | 0.1 /100 | #272 | Tragic $54,212 |
| Indonesians | 0.1 /100 | #273 | Tragic $54,176 |
| Barbadians | 0.1 /100 | #274 | Tragic $54,163 |
| Cherokee | 0.1 /100 | #275 | Tragic $54,133 |
| Cree | 0.1 /100 | #276 | Tragic $54,129 |
| Cheyenne | 0.1 /100 | #277 | Tragic $54,096 |
| Immigrants | Ecuador | 0.1 /100 | #278 | Tragic $54,030 |
| Blackfeet | 0.1 /100 | #279 | Tragic $54,029 |
| Immigrants | Jamaica | 0.1 /100 | #280 | Tragic $54,027 |
| Somalis | 0.1 /100 | #281 | Tragic $54,004 |
| Immigrants | Armenia | 0.1 /100 | #282 | Tragic $53,974 |
Demographics Similar to Hungarians by Householder Income Over 65 years
In terms of householder income over 65 years, the demographic groups most similar to Hungarians are Armenian ($61,656, a difference of 0.030%), Slavic ($61,709, a difference of 0.060%), Costa Rican ($61,638, a difference of 0.060%), Swiss ($61,621, a difference of 0.080%), and Scottish ($61,735, a difference of 0.10%).
| Demographics | Rating | Rank | Householder Income Over 65 years |
| Immigrants | Peru | 74.4 /100 | #144 | Good $61,988 |
| Immigrants | Uganda | 74.2 /100 | #145 | Good $61,976 |
| Immigrants | Southern Europe | 72.7 /100 | #146 | Good $61,902 |
| Immigrants | Nepal | 71.4 /100 | #147 | Good $61,843 |
| Alsatians | 70.5 /100 | #148 | Good $61,797 |
| Scottish | 69.1 /100 | #149 | Good $61,735 |
| Slavs | 68.5 /100 | #150 | Good $61,709 |
| Hungarians | 67.7 /100 | #151 | Good $61,673 |
| Armenians | 67.3 /100 | #152 | Good $61,656 |
| Costa Ricans | 66.9 /100 | #153 | Good $61,638 |
| Swiss | 66.5 /100 | #154 | Good $61,621 |
| Poles | 65.9 /100 | #155 | Good $61,598 |
| Scandinavians | 65.6 /100 | #156 | Good $61,586 |
| Macedonians | 65.1 /100 | #157 | Good $61,564 |
| English | 63.3 /100 | #158 | Good $61,487 |