Central American Indian vs Immigrants from Uzbekistan Single Female Poverty
COMPARE
Central American Indian
Immigrants from Uzbekistan
Single Female Poverty
Single Female Poverty Comparison
Central American Indians
Immigrants from Uzbekistan
25.5%
SINGLE FEMALE POVERTY
0.0/ 100
METRIC RATING
310th/ 347
METRIC RANK
20.3%
SINGLE FEMALE POVERTY
88.3/ 100
METRIC RATING
144th/ 347
METRIC RANK
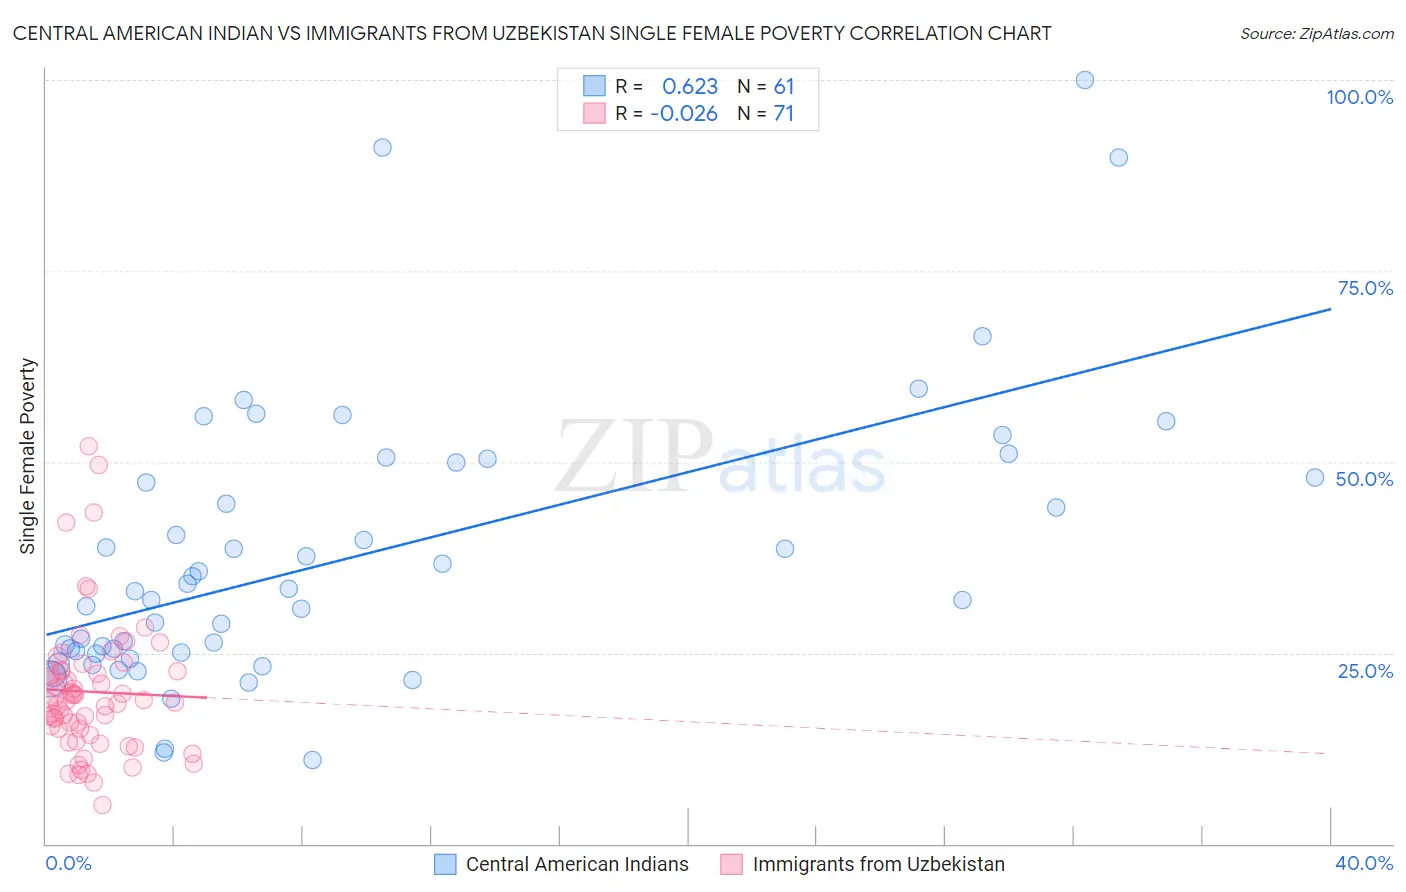
Central American Indian vs Immigrants from Uzbekistan Single Female Poverty Correlation Chart
The statistical analysis conducted on geographies consisting of 323,666,158 people shows a significant positive correlation between the proportion of Central American Indians and poverty level among single females in the United States with a correlation coefficient (R) of 0.623 and weighted average of 25.5%. Similarly, the statistical analysis conducted on geographies consisting of 118,122,689 people shows no correlation between the proportion of Immigrants from Uzbekistan and poverty level among single females in the United States with a correlation coefficient (R) of -0.026 and weighted average of 20.3%, a difference of 25.1%.
Single Female Poverty Correlation Summary
| Measurement | Central American Indian | Immigrants from Uzbekistan |
| Minimum | 11.0% | 5.1% |
| Maximum | 100.0% | 52.0% |
| Range | 89.0% | 46.9% |
| Mean | 37.6% | 19.9% |
| Median | 33.1% | 18.6% |
| Interquartile 25% (IQ1) | 24.9% | 15.0% |
| Interquartile 75% (IQ3) | 49.0% | 22.7% |
| Interquartile Range (IQR) | 24.0% | 7.7% |
| Standard Deviation (Sample) | 18.3% | 8.8% |
| Standard Deviation (Population) | 18.2% | 8.8% |
Similar Demographics by Single Female Poverty
Demographics Similar to Central American Indians by Single Female Poverty
In terms of single female poverty, the demographic groups most similar to Central American Indians are Dominican (25.4%, a difference of 0.15%), Aleut (25.4%, a difference of 0.16%), Immigrants from Honduras (25.5%, a difference of 0.28%), Potawatomi (25.4%, a difference of 0.33%), and Paiute (25.5%, a difference of 0.33%).
| Demographics | Rating | Rank | Single Female Poverty |
| Somalis | 0.0 /100 | #303 | Tragic 25.2% |
| Immigrants | Congo | 0.0 /100 | #304 | Tragic 25.3% |
| Immigrants | Dominican Republic | 0.0 /100 | #305 | Tragic 25.3% |
| Immigrants | Mexico | 0.0 /100 | #306 | Tragic 25.3% |
| Potawatomi | 0.0 /100 | #307 | Tragic 25.4% |
| Aleuts | 0.0 /100 | #308 | Tragic 25.4% |
| Dominicans | 0.0 /100 | #309 | Tragic 25.4% |
| Central American Indians | 0.0 /100 | #310 | Tragic 25.5% |
| Immigrants | Honduras | 0.0 /100 | #311 | Tragic 25.5% |
| Paiute | 0.0 /100 | #312 | Tragic 25.5% |
| Comanche | 0.0 /100 | #313 | Tragic 25.6% |
| Cherokee | 0.0 /100 | #314 | Tragic 25.7% |
| Iroquois | 0.0 /100 | #315 | Tragic 25.7% |
| Immigrants | Somalia | 0.0 /100 | #316 | Tragic 25.8% |
| Ottawa | 0.0 /100 | #317 | Tragic 26.0% |
Demographics Similar to Immigrants from Uzbekistan by Single Female Poverty
In terms of single female poverty, the demographic groups most similar to Immigrants from Uzbekistan are Australian (20.3%, a difference of 0.010%), Immigrants from Uganda (20.3%, a difference of 0.13%), Immigrants from North America (20.3%, a difference of 0.20%), Syrian (20.3%, a difference of 0.35%), and Immigrants from Kuwait (20.3%, a difference of 0.36%).
| Demographics | Rating | Rank | Single Female Poverty |
| Immigrants | Nepal | 90.6 /100 | #137 | Exceptional 20.3% |
| Slovenes | 90.5 /100 | #138 | Exceptional 20.3% |
| Immigrants | Kuwait | 90.4 /100 | #139 | Exceptional 20.3% |
| Syrians | 90.4 /100 | #140 | Exceptional 20.3% |
| Immigrants | North America | 89.5 /100 | #141 | Excellent 20.3% |
| Immigrants | Uganda | 89.1 /100 | #142 | Excellent 20.3% |
| Australians | 88.4 /100 | #143 | Excellent 20.3% |
| Immigrants | Uzbekistan | 88.3 /100 | #144 | Excellent 20.3% |
| Austrians | 85.8 /100 | #145 | Excellent 20.4% |
| Venezuelans | 85.5 /100 | #146 | Excellent 20.4% |
| South Africans | 85.3 /100 | #147 | Excellent 20.4% |
| Luxembourgers | 84.9 /100 | #148 | Excellent 20.4% |
| Portuguese | 81.5 /100 | #149 | Excellent 20.5% |
| Immigrants | Denmark | 80.5 /100 | #150 | Excellent 20.5% |
| Puget Sound Salish | 79.6 /100 | #151 | Good 20.6% |