Immigrants from Cabo Verde vs Immigrants from Uzbekistan Single Female Poverty
COMPARE
Immigrants from Cabo Verde
Immigrants from Uzbekistan
Single Female Poverty
Single Female Poverty Comparison
Immigrants from Cabo Verde
Immigrants from Uzbekistan
22.8%
SINGLE FEMALE POVERTY
0.4/ 100
METRIC RATING
261st/ 347
METRIC RANK
20.3%
SINGLE FEMALE POVERTY
88.3/ 100
METRIC RATING
144th/ 347
METRIC RANK
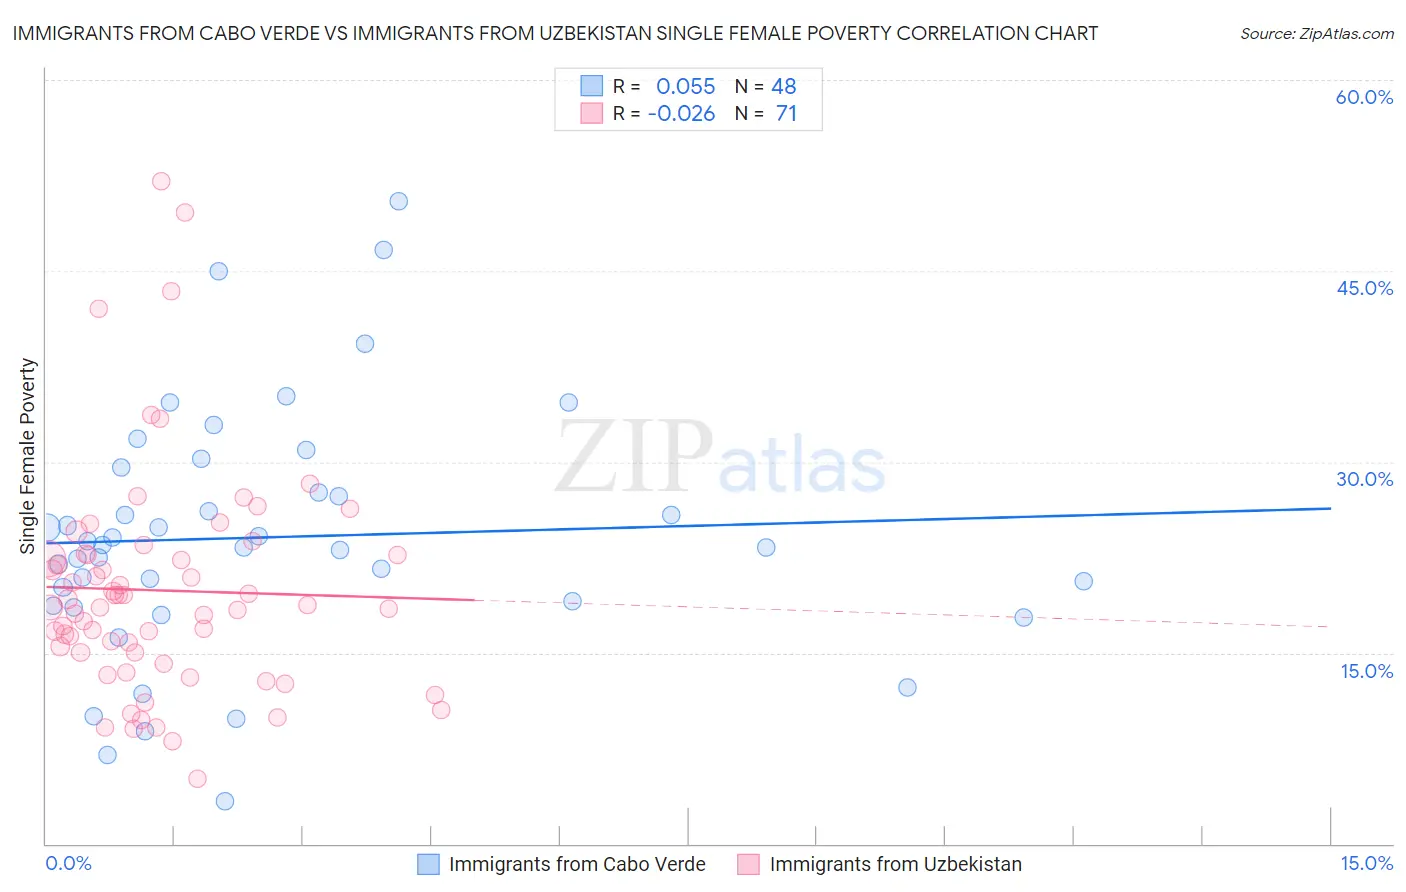
Immigrants from Cabo Verde vs Immigrants from Uzbekistan Single Female Poverty Correlation Chart
The statistical analysis conducted on geographies consisting of 38,021,113 people shows a slight positive correlation between the proportion of Immigrants from Cabo Verde and poverty level among single females in the United States with a correlation coefficient (R) of 0.055 and weighted average of 22.8%. Similarly, the statistical analysis conducted on geographies consisting of 118,122,689 people shows no correlation between the proportion of Immigrants from Uzbekistan and poverty level among single females in the United States with a correlation coefficient (R) of -0.026 and weighted average of 20.3%, a difference of 12.0%.
Single Female Poverty Correlation Summary
| Measurement | Immigrants from Cabo Verde | Immigrants from Uzbekistan |
| Minimum | 3.4% | 5.1% |
| Maximum | 50.5% | 52.0% |
| Range | 47.1% | 46.9% |
| Mean | 24.1% | 19.9% |
| Median | 23.4% | 18.6% |
| Interquartile 25% (IQ1) | 18.9% | 15.0% |
| Interquartile 75% (IQ3) | 28.6% | 22.7% |
| Interquartile Range (IQR) | 9.7% | 7.7% |
| Standard Deviation (Sample) | 9.7% | 8.8% |
| Standard Deviation (Population) | 9.6% | 8.8% |
Similar Demographics by Single Female Poverty
Demographics Similar to Immigrants from Cabo Verde by Single Female Poverty
In terms of single female poverty, the demographic groups most similar to Immigrants from Cabo Verde are British West Indian (22.8%, a difference of 0.25%), Celtic (22.7%, a difference of 0.27%), White/Caucasian (22.7%, a difference of 0.34%), Bahamian (22.7%, a difference of 0.48%), and Scotch-Irish (22.9%, a difference of 0.66%).
| Demographics | Rating | Rank | Single Female Poverty |
| Immigrants | Burma/Myanmar | 0.8 /100 | #254 | Tragic 22.6% |
| Immigrants | Sudan | 0.8 /100 | #255 | Tragic 22.6% |
| Immigrants | Belize | 0.8 /100 | #256 | Tragic 22.6% |
| Sudanese | 0.7 /100 | #257 | Tragic 22.6% |
| Bahamians | 0.6 /100 | #258 | Tragic 22.7% |
| Whites/Caucasians | 0.6 /100 | #259 | Tragic 22.7% |
| Celtics | 0.5 /100 | #260 | Tragic 22.7% |
| Immigrants | Cabo Verde | 0.4 /100 | #261 | Tragic 22.8% |
| British West Indians | 0.4 /100 | #262 | Tragic 22.8% |
| Scotch-Irish | 0.3 /100 | #263 | Tragic 22.9% |
| Immigrants | Laos | 0.3 /100 | #264 | Tragic 22.9% |
| Central Americans | 0.2 /100 | #265 | Tragic 23.0% |
| Immigrants | Micronesia | 0.2 /100 | #266 | Tragic 23.0% |
| Senegalese | 0.2 /100 | #267 | Tragic 23.0% |
| Fijians | 0.2 /100 | #268 | Tragic 23.1% |
Demographics Similar to Immigrants from Uzbekistan by Single Female Poverty
In terms of single female poverty, the demographic groups most similar to Immigrants from Uzbekistan are Australian (20.3%, a difference of 0.010%), Immigrants from Uganda (20.3%, a difference of 0.13%), Immigrants from North America (20.3%, a difference of 0.20%), Syrian (20.3%, a difference of 0.35%), and Immigrants from Kuwait (20.3%, a difference of 0.36%).
| Demographics | Rating | Rank | Single Female Poverty |
| Immigrants | Nepal | 90.6 /100 | #137 | Exceptional 20.3% |
| Slovenes | 90.5 /100 | #138 | Exceptional 20.3% |
| Immigrants | Kuwait | 90.4 /100 | #139 | Exceptional 20.3% |
| Syrians | 90.4 /100 | #140 | Exceptional 20.3% |
| Immigrants | North America | 89.5 /100 | #141 | Excellent 20.3% |
| Immigrants | Uganda | 89.1 /100 | #142 | Excellent 20.3% |
| Australians | 88.4 /100 | #143 | Excellent 20.3% |
| Immigrants | Uzbekistan | 88.3 /100 | #144 | Excellent 20.3% |
| Austrians | 85.8 /100 | #145 | Excellent 20.4% |
| Venezuelans | 85.5 /100 | #146 | Excellent 20.4% |
| South Africans | 85.3 /100 | #147 | Excellent 20.4% |
| Luxembourgers | 84.9 /100 | #148 | Excellent 20.4% |
| Portuguese | 81.5 /100 | #149 | Excellent 20.5% |
| Immigrants | Denmark | 80.5 /100 | #150 | Excellent 20.5% |
| Puget Sound Salish | 79.6 /100 | #151 | Good 20.6% |