Central American Indian vs Blackfeet Single Female Poverty
COMPARE
Central American Indian
Blackfeet
Single Female Poverty
Single Female Poverty Comparison
Central American Indians
Blackfeet
25.5%
SINGLE FEMALE POVERTY
0.0/ 100
METRIC RATING
310th/ 347
METRIC RANK
25.1%
SINGLE FEMALE POVERTY
0.0/ 100
METRIC RATING
300th/ 347
METRIC RANK
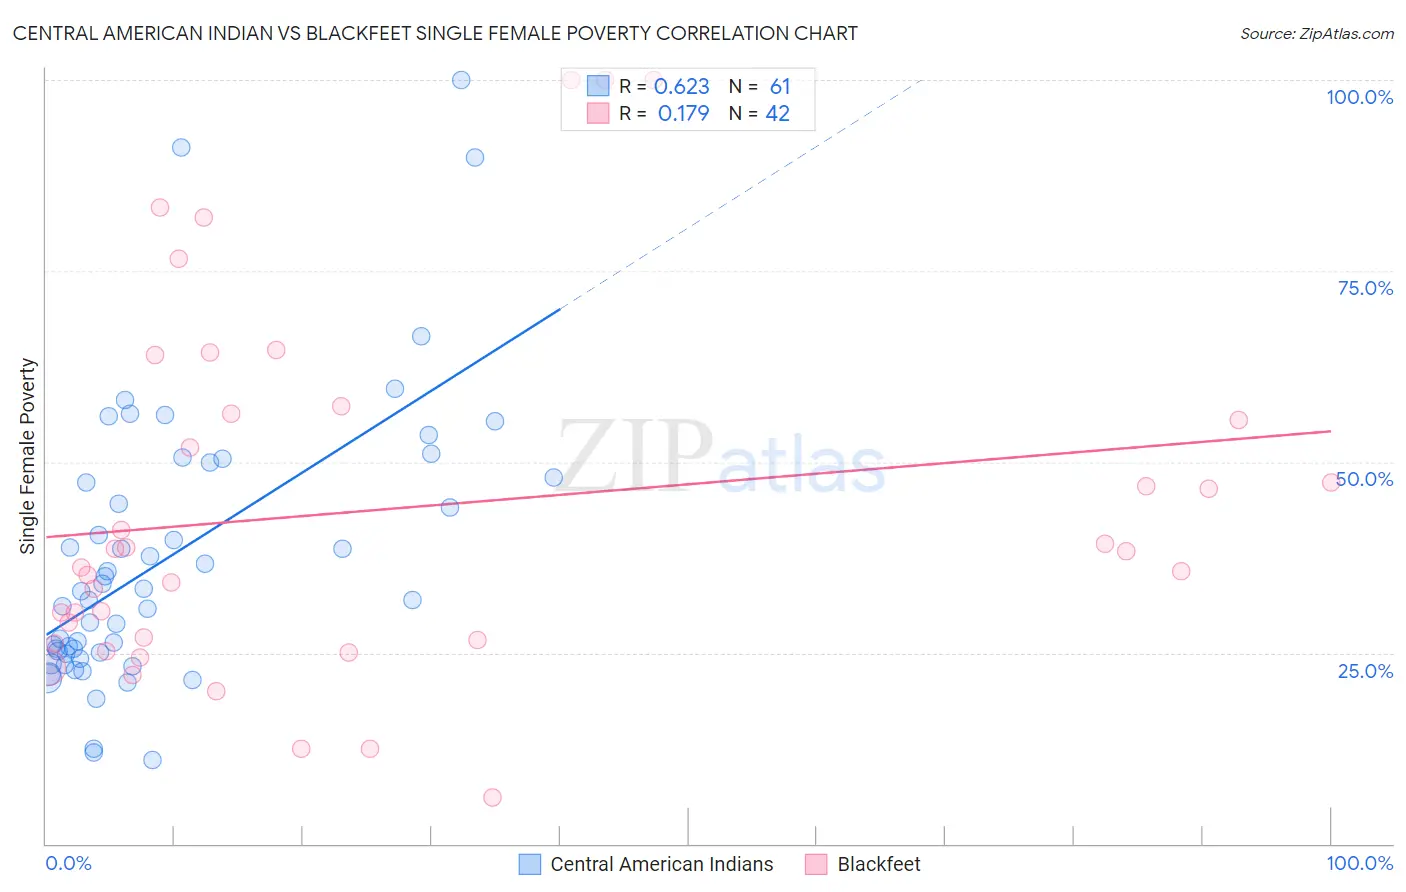
Central American Indian vs Blackfeet Single Female Poverty Correlation Chart
The statistical analysis conducted on geographies consisting of 323,666,158 people shows a significant positive correlation between the proportion of Central American Indians and poverty level among single females in the United States with a correlation coefficient (R) of 0.623 and weighted average of 25.5%. Similarly, the statistical analysis conducted on geographies consisting of 307,344,342 people shows a poor positive correlation between the proportion of Blackfeet and poverty level among single females in the United States with a correlation coefficient (R) of 0.179 and weighted average of 25.1%, a difference of 1.6%.
Single Female Poverty Correlation Summary
| Measurement | Central American Indian | Blackfeet |
| Minimum | 11.0% | 6.1% |
| Maximum | 100.0% | 100.0% |
| Range | 89.0% | 93.9% |
| Mean | 37.6% | 43.8% |
| Median | 33.1% | 37.2% |
| Interquartile 25% (IQ1) | 24.9% | 26.7% |
| Interquartile 75% (IQ3) | 49.0% | 56.2% |
| Interquartile Range (IQR) | 24.0% | 29.6% |
| Standard Deviation (Sample) | 18.3% | 23.9% |
| Standard Deviation (Population) | 18.2% | 23.6% |
Demographics Similar to Central American Indians and Blackfeet by Single Female Poverty
In terms of single female poverty, the demographic groups most similar to Central American Indians are Dominican (25.4%, a difference of 0.15%), Aleut (25.4%, a difference of 0.16%), Immigrants from Honduras (25.5%, a difference of 0.28%), Potawatomi (25.4%, a difference of 0.33%), and Paiute (25.5%, a difference of 0.33%). Similarly, the demographic groups most similar to Blackfeet are Mexican (25.0%, a difference of 0.080%), Honduran (25.1%, a difference of 0.18%), Shoshone (25.1%, a difference of 0.26%), Somali (25.2%, a difference of 0.66%), and Yaqui (24.9%, a difference of 0.74%).
| Demographics | Rating | Rank | Single Female Poverty |
| Hispanics or Latinos | 0.0 /100 | #295 | Tragic 24.6% |
| Africans | 0.0 /100 | #296 | Tragic 24.8% |
| Immigrants | Central America | 0.0 /100 | #297 | Tragic 24.8% |
| Yaqui | 0.0 /100 | #298 | Tragic 24.9% |
| Mexicans | 0.0 /100 | #299 | Tragic 25.0% |
| Blackfeet | 0.0 /100 | #300 | Tragic 25.1% |
| Hondurans | 0.0 /100 | #301 | Tragic 25.1% |
| Shoshone | 0.0 /100 | #302 | Tragic 25.1% |
| Somalis | 0.0 /100 | #303 | Tragic 25.2% |
| Immigrants | Congo | 0.0 /100 | #304 | Tragic 25.3% |
| Immigrants | Dominican Republic | 0.0 /100 | #305 | Tragic 25.3% |
| Immigrants | Mexico | 0.0 /100 | #306 | Tragic 25.3% |
| Potawatomi | 0.0 /100 | #307 | Tragic 25.4% |
| Aleuts | 0.0 /100 | #308 | Tragic 25.4% |
| Dominicans | 0.0 /100 | #309 | Tragic 25.4% |
| Central American Indians | 0.0 /100 | #310 | Tragic 25.5% |
| Immigrants | Honduras | 0.0 /100 | #311 | Tragic 25.5% |
| Paiute | 0.0 /100 | #312 | Tragic 25.5% |
| Comanche | 0.0 /100 | #313 | Tragic 25.6% |
| Cherokee | 0.0 /100 | #314 | Tragic 25.7% |
| Iroquois | 0.0 /100 | #315 | Tragic 25.7% |