Central American Indian vs Immigrants from Switzerland Single Female Poverty
COMPARE
Central American Indian
Immigrants from Switzerland
Single Female Poverty
Single Female Poverty Comparison
Central American Indians
Immigrants from Switzerland
25.5%
SINGLE FEMALE POVERTY
0.0/ 100
METRIC RATING
310th/ 347
METRIC RANK
20.0%
SINGLE FEMALE POVERTY
95.1/ 100
METRIC RATING
121st/ 347
METRIC RANK
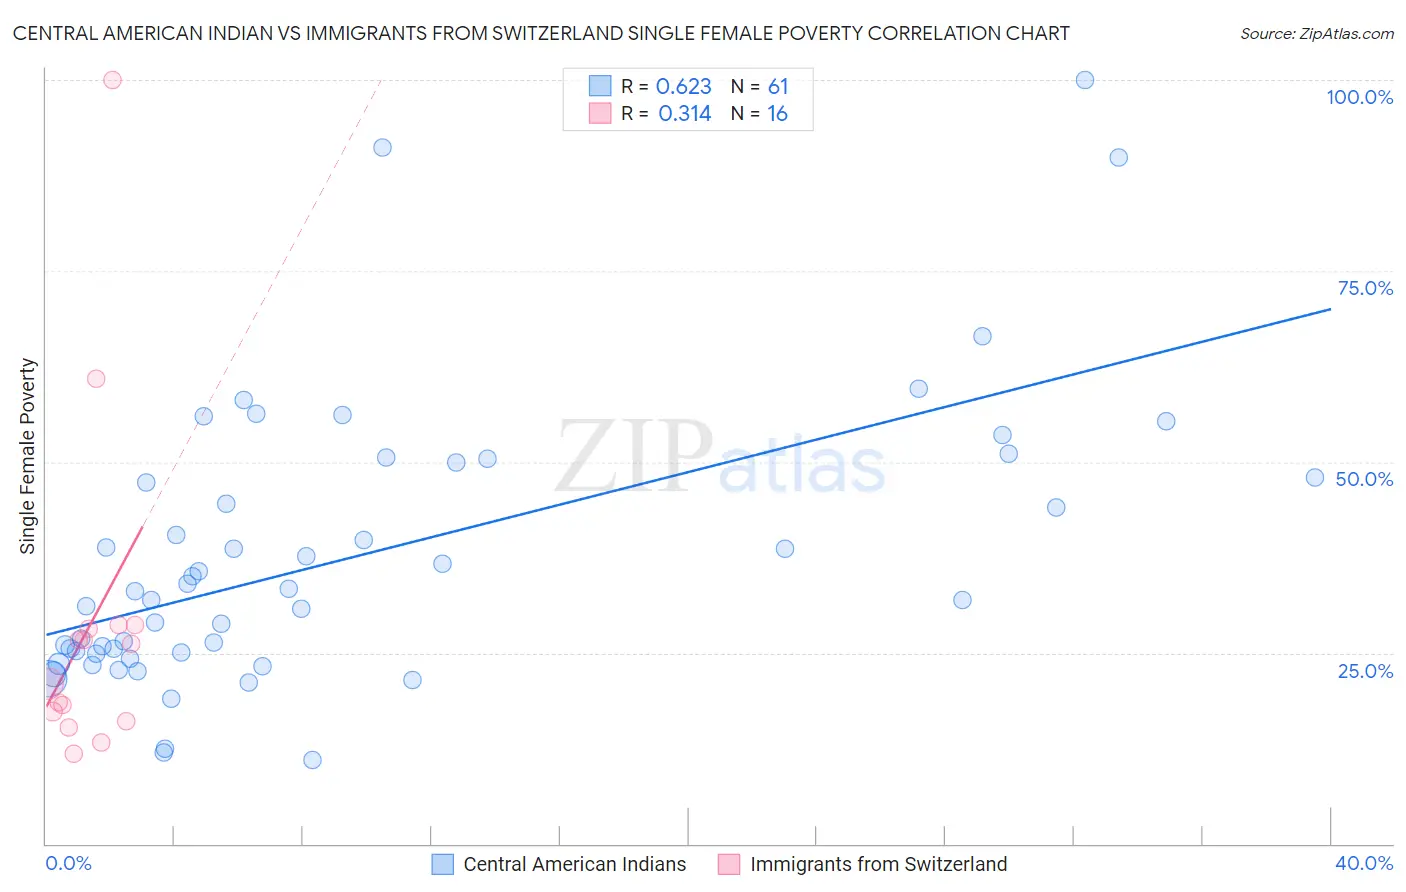
Central American Indian vs Immigrants from Switzerland Single Female Poverty Correlation Chart
The statistical analysis conducted on geographies consisting of 323,666,158 people shows a significant positive correlation between the proportion of Central American Indians and poverty level among single females in the United States with a correlation coefficient (R) of 0.623 and weighted average of 25.5%. Similarly, the statistical analysis conducted on geographies consisting of 146,751,859 people shows a mild positive correlation between the proportion of Immigrants from Switzerland and poverty level among single females in the United States with a correlation coefficient (R) of 0.314 and weighted average of 20.0%, a difference of 27.0%.
Single Female Poverty Correlation Summary
| Measurement | Central American Indian | Immigrants from Switzerland |
| Minimum | 11.0% | 11.7% |
| Maximum | 100.0% | 100.0% |
| Range | 89.0% | 88.3% |
| Mean | 37.6% | 28.5% |
| Median | 33.1% | 23.5% |
| Interquartile 25% (IQ1) | 24.9% | 16.6% |
| Interquartile 75% (IQ3) | 49.0% | 28.3% |
| Interquartile Range (IQR) | 24.0% | 11.7% |
| Standard Deviation (Sample) | 18.3% | 22.2% |
| Standard Deviation (Population) | 18.2% | 21.5% |
Similar Demographics by Single Female Poverty
Demographics Similar to Central American Indians by Single Female Poverty
In terms of single female poverty, the demographic groups most similar to Central American Indians are Dominican (25.4%, a difference of 0.15%), Aleut (25.4%, a difference of 0.16%), Immigrants from Honduras (25.5%, a difference of 0.28%), Potawatomi (25.4%, a difference of 0.33%), and Paiute (25.5%, a difference of 0.33%).
| Demographics | Rating | Rank | Single Female Poverty |
| Somalis | 0.0 /100 | #303 | Tragic 25.2% |
| Immigrants | Congo | 0.0 /100 | #304 | Tragic 25.3% |
| Immigrants | Dominican Republic | 0.0 /100 | #305 | Tragic 25.3% |
| Immigrants | Mexico | 0.0 /100 | #306 | Tragic 25.3% |
| Potawatomi | 0.0 /100 | #307 | Tragic 25.4% |
| Aleuts | 0.0 /100 | #308 | Tragic 25.4% |
| Dominicans | 0.0 /100 | #309 | Tragic 25.4% |
| Central American Indians | 0.0 /100 | #310 | Tragic 25.5% |
| Immigrants | Honduras | 0.0 /100 | #311 | Tragic 25.5% |
| Paiute | 0.0 /100 | #312 | Tragic 25.5% |
| Comanche | 0.0 /100 | #313 | Tragic 25.6% |
| Cherokee | 0.0 /100 | #314 | Tragic 25.7% |
| Iroquois | 0.0 /100 | #315 | Tragic 25.7% |
| Immigrants | Somalia | 0.0 /100 | #316 | Tragic 25.8% |
| Ottawa | 0.0 /100 | #317 | Tragic 26.0% |
Demographics Similar to Immigrants from Switzerland by Single Female Poverty
In terms of single female poverty, the demographic groups most similar to Immigrants from Switzerland are South American (20.0%, a difference of 0.030%), Immigrants from South America (20.0%, a difference of 0.030%), Immigrants from Afghanistan (20.0%, a difference of 0.13%), Immigrants from Ethiopia (20.0%, a difference of 0.13%), and Polish (20.0%, a difference of 0.20%).
| Demographics | Rating | Rank | Single Female Poverty |
| Immigrants | Colombia | 95.9 /100 | #114 | Exceptional 20.0% |
| Immigrants | Northern Africa | 95.8 /100 | #115 | Exceptional 20.0% |
| Immigrants | Kazakhstan | 95.7 /100 | #116 | Exceptional 20.0% |
| Poles | 95.6 /100 | #117 | Exceptional 20.0% |
| Immigrants | Afghanistan | 95.4 /100 | #118 | Exceptional 20.0% |
| Immigrants | Ethiopia | 95.4 /100 | #119 | Exceptional 20.0% |
| South Americans | 95.1 /100 | #120 | Exceptional 20.0% |
| Immigrants | Switzerland | 95.1 /100 | #121 | Exceptional 20.0% |
| Immigrants | South America | 95.0 /100 | #122 | Exceptional 20.0% |
| Brazilians | 94.4 /100 | #123 | Exceptional 20.1% |
| Immigrants | Chile | 94.3 /100 | #124 | Exceptional 20.1% |
| Immigrants | South Africa | 93.9 /100 | #125 | Exceptional 20.1% |
| Serbians | 93.3 /100 | #126 | Exceptional 20.1% |
| Mongolians | 93.2 /100 | #127 | Exceptional 20.2% |
| Immigrants | Spain | 92.7 /100 | #128 | Exceptional 20.2% |