Central American Indian vs Hopi Single Female Poverty
COMPARE
Central American Indian
Hopi
Single Female Poverty
Single Female Poverty Comparison
Central American Indians
Hopi
25.5%
SINGLE FEMALE POVERTY
0.0/ 100
METRIC RATING
310th/ 347
METRIC RANK
28.0%
SINGLE FEMALE POVERTY
0.0/ 100
METRIC RATING
330th/ 347
METRIC RANK
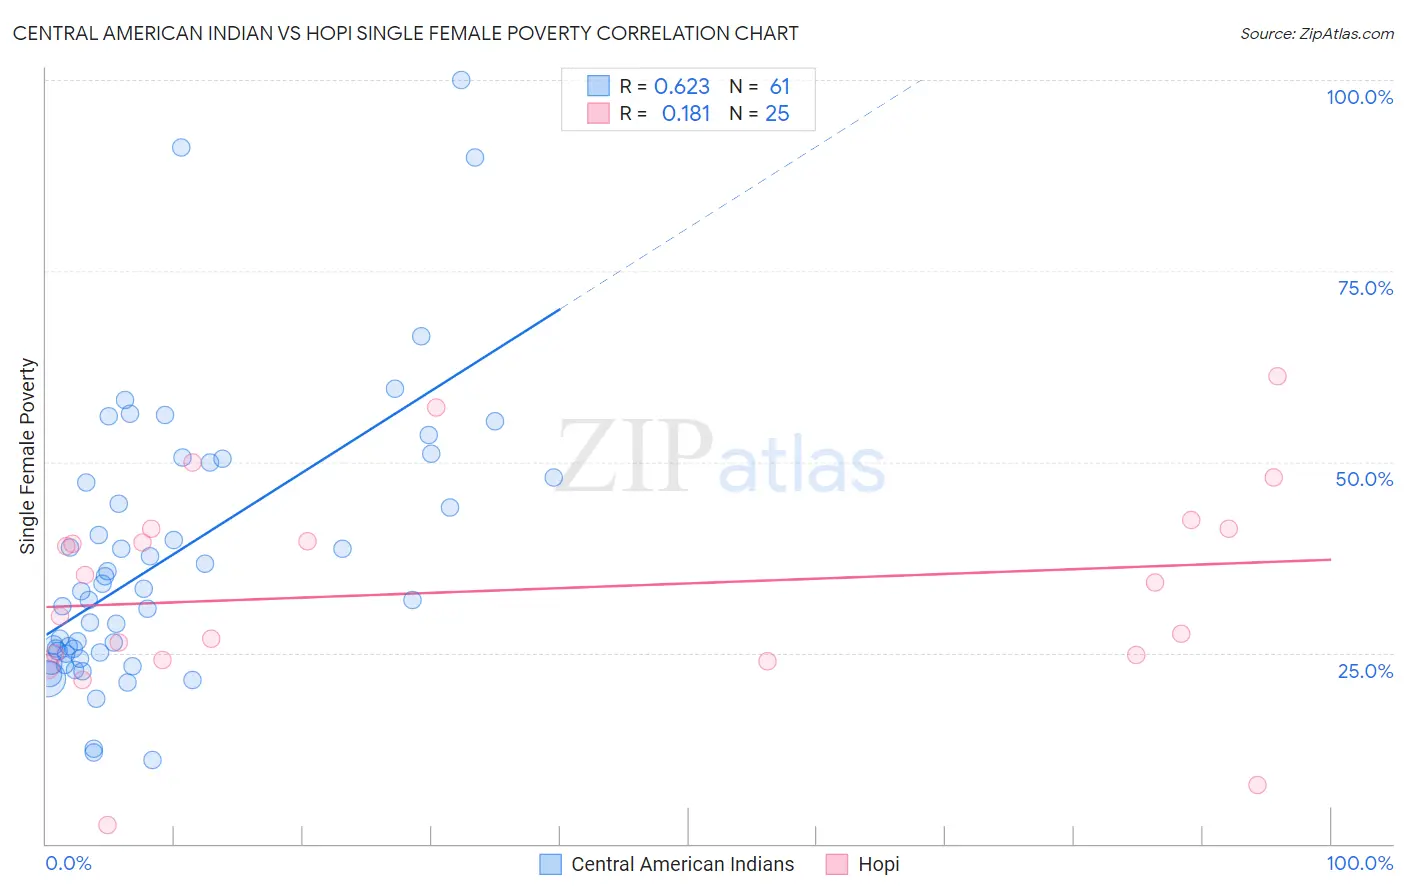
Central American Indian vs Hopi Single Female Poverty Correlation Chart
The statistical analysis conducted on geographies consisting of 323,666,158 people shows a significant positive correlation between the proportion of Central American Indians and poverty level among single females in the United States with a correlation coefficient (R) of 0.623 and weighted average of 25.5%. Similarly, the statistical analysis conducted on geographies consisting of 74,526,987 people shows a poor positive correlation between the proportion of Hopi and poverty level among single females in the United States with a correlation coefficient (R) of 0.181 and weighted average of 28.0%, a difference of 10.1%.
Single Female Poverty Correlation Summary
| Measurement | Central American Indian | Hopi |
| Minimum | 11.0% | 2.4% |
| Maximum | 100.0% | 61.3% |
| Range | 89.0% | 58.9% |
| Mean | 37.6% | 33.2% |
| Median | 33.1% | 34.3% |
| Interquartile 25% (IQ1) | 24.9% | 24.4% |
| Interquartile 75% (IQ3) | 49.0% | 41.2% |
| Interquartile Range (IQR) | 24.0% | 16.8% |
| Standard Deviation (Sample) | 18.3% | 13.7% |
| Standard Deviation (Population) | 18.2% | 13.4% |
Demographics Similar to Central American Indians and Hopi by Single Female Poverty
In terms of single female poverty, the demographic groups most similar to Central American Indians are Immigrants from Honduras (25.5%, a difference of 0.28%), Paiute (25.5%, a difference of 0.33%), Comanche (25.6%, a difference of 0.44%), Cherokee (25.7%, a difference of 0.80%), and Iroquois (25.7%, a difference of 1.1%). Similarly, the demographic groups most similar to Hopi are Menominee (27.8%, a difference of 0.71%), Apache (27.7%, a difference of 1.2%), Dutch West Indian (27.5%, a difference of 2.1%), Creek (27.4%, a difference of 2.2%), and Choctaw (27.2%, a difference of 3.1%).
| Demographics | Rating | Rank | Single Female Poverty |
| Central American Indians | 0.0 /100 | #310 | Tragic 25.5% |
| Immigrants | Honduras | 0.0 /100 | #311 | Tragic 25.5% |
| Paiute | 0.0 /100 | #312 | Tragic 25.5% |
| Comanche | 0.0 /100 | #313 | Tragic 25.6% |
| Cherokee | 0.0 /100 | #314 | Tragic 25.7% |
| Iroquois | 0.0 /100 | #315 | Tragic 25.7% |
| Immigrants | Somalia | 0.0 /100 | #316 | Tragic 25.8% |
| Ottawa | 0.0 /100 | #317 | Tragic 26.0% |
| Chickasaw | 0.0 /100 | #318 | Tragic 26.3% |
| Blacks/African Americans | 0.0 /100 | #319 | Tragic 26.4% |
| Arapaho | 0.0 /100 | #320 | Tragic 26.4% |
| Yup'ik | 0.0 /100 | #321 | Tragic 26.6% |
| Seminole | 0.0 /100 | #322 | Tragic 26.8% |
| Chippewa | 0.0 /100 | #323 | Tragic 26.8% |
| Kiowa | 0.0 /100 | #324 | Tragic 26.9% |
| Choctaw | 0.0 /100 | #325 | Tragic 27.2% |
| Creek | 0.0 /100 | #326 | Tragic 27.4% |
| Dutch West Indians | 0.0 /100 | #327 | Tragic 27.5% |
| Apache | 0.0 /100 | #328 | Tragic 27.7% |
| Menominee | 0.0 /100 | #329 | Tragic 27.8% |
| Hopi | 0.0 /100 | #330 | Tragic 28.0% |