Central American Indian vs Immigrants from Belize Single Female Poverty
COMPARE
Central American Indian
Immigrants from Belize
Single Female Poverty
Single Female Poverty Comparison
Central American Indians
Immigrants from Belize
25.5%
SINGLE FEMALE POVERTY
0.0/ 100
METRIC RATING
310th/ 347
METRIC RANK
22.6%
SINGLE FEMALE POVERTY
0.8/ 100
METRIC RATING
256th/ 347
METRIC RANK
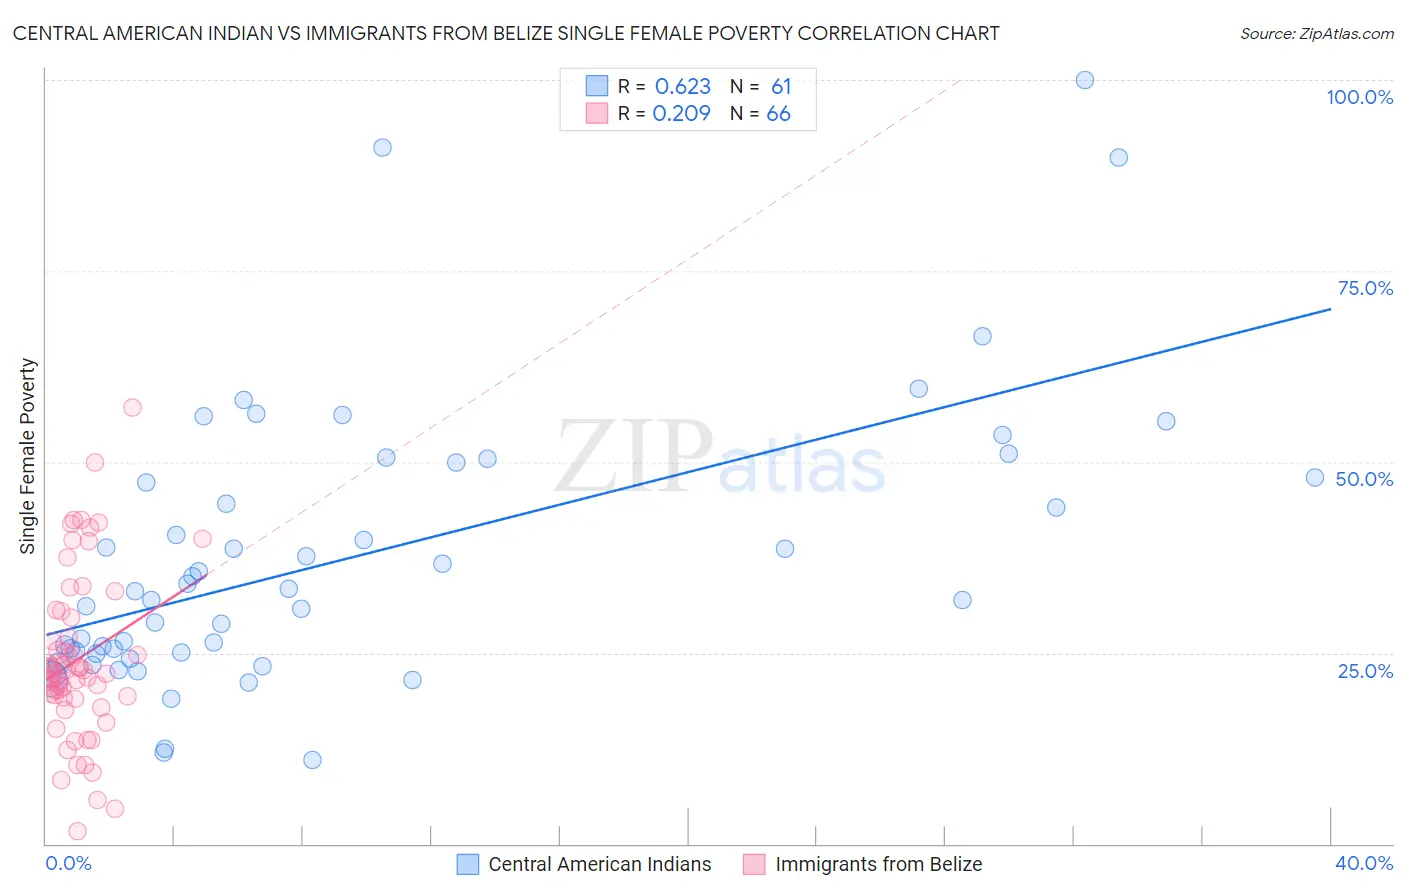
Central American Indian vs Immigrants from Belize Single Female Poverty Correlation Chart
The statistical analysis conducted on geographies consisting of 323,666,158 people shows a significant positive correlation between the proportion of Central American Indians and poverty level among single females in the United States with a correlation coefficient (R) of 0.623 and weighted average of 25.5%. Similarly, the statistical analysis conducted on geographies consisting of 129,926,681 people shows a weak positive correlation between the proportion of Immigrants from Belize and poverty level among single females in the United States with a correlation coefficient (R) of 0.209 and weighted average of 22.6%, a difference of 12.7%.
Single Female Poverty Correlation Summary
| Measurement | Central American Indian | Immigrants from Belize |
| Minimum | 11.0% | 1.7% |
| Maximum | 100.0% | 57.1% |
| Range | 89.0% | 55.5% |
| Mean | 37.6% | 24.1% |
| Median | 33.1% | 22.5% |
| Interquartile 25% (IQ1) | 24.9% | 19.1% |
| Interquartile 75% (IQ3) | 49.0% | 29.6% |
| Interquartile Range (IQR) | 24.0% | 10.5% |
| Standard Deviation (Sample) | 18.3% | 10.9% |
| Standard Deviation (Population) | 18.2% | 10.8% |
Similar Demographics by Single Female Poverty
Demographics Similar to Central American Indians by Single Female Poverty
In terms of single female poverty, the demographic groups most similar to Central American Indians are Dominican (25.4%, a difference of 0.15%), Aleut (25.4%, a difference of 0.16%), Immigrants from Honduras (25.5%, a difference of 0.28%), Potawatomi (25.4%, a difference of 0.33%), and Paiute (25.5%, a difference of 0.33%).
| Demographics | Rating | Rank | Single Female Poverty |
| Somalis | 0.0 /100 | #303 | Tragic 25.2% |
| Immigrants | Congo | 0.0 /100 | #304 | Tragic 25.3% |
| Immigrants | Dominican Republic | 0.0 /100 | #305 | Tragic 25.3% |
| Immigrants | Mexico | 0.0 /100 | #306 | Tragic 25.3% |
| Potawatomi | 0.0 /100 | #307 | Tragic 25.4% |
| Aleuts | 0.0 /100 | #308 | Tragic 25.4% |
| Dominicans | 0.0 /100 | #309 | Tragic 25.4% |
| Central American Indians | 0.0 /100 | #310 | Tragic 25.5% |
| Immigrants | Honduras | 0.0 /100 | #311 | Tragic 25.5% |
| Paiute | 0.0 /100 | #312 | Tragic 25.5% |
| Comanche | 0.0 /100 | #313 | Tragic 25.6% |
| Cherokee | 0.0 /100 | #314 | Tragic 25.7% |
| Iroquois | 0.0 /100 | #315 | Tragic 25.7% |
| Immigrants | Somalia | 0.0 /100 | #316 | Tragic 25.8% |
| Ottawa | 0.0 /100 | #317 | Tragic 26.0% |
Demographics Similar to Immigrants from Belize by Single Female Poverty
In terms of single female poverty, the demographic groups most similar to Immigrants from Belize are Immigrants from Sudan (22.6%, a difference of 0.14%), Sudanese (22.6%, a difference of 0.14%), Immigrants from Burma/Myanmar (22.6%, a difference of 0.15%), Immigrants from Liberia (22.5%, a difference of 0.25%), and Delaware (22.5%, a difference of 0.34%).
| Demographics | Rating | Rank | Single Female Poverty |
| Immigrants | Caribbean | 1.3 /100 | #249 | Tragic 22.4% |
| Immigrants | Bahamas | 1.2 /100 | #250 | Tragic 22.5% |
| Immigrants | West Indies | 1.0 /100 | #251 | Tragic 22.5% |
| Delaware | 1.0 /100 | #252 | Tragic 22.5% |
| Immigrants | Liberia | 0.9 /100 | #253 | Tragic 22.5% |
| Immigrants | Burma/Myanmar | 0.8 /100 | #254 | Tragic 22.6% |
| Immigrants | Sudan | 0.8 /100 | #255 | Tragic 22.6% |
| Immigrants | Belize | 0.8 /100 | #256 | Tragic 22.6% |
| Sudanese | 0.7 /100 | #257 | Tragic 22.6% |
| Bahamians | 0.6 /100 | #258 | Tragic 22.7% |
| Whites/Caucasians | 0.6 /100 | #259 | Tragic 22.7% |
| Celtics | 0.5 /100 | #260 | Tragic 22.7% |
| Immigrants | Cabo Verde | 0.4 /100 | #261 | Tragic 22.8% |
| British West Indians | 0.4 /100 | #262 | Tragic 22.8% |
| Scotch-Irish | 0.3 /100 | #263 | Tragic 22.9% |