Central American Indian vs Immigrants from Uzbekistan In Labor Force | Age 45-54
COMPARE
Central American Indian
Immigrants from Uzbekistan
In Labor Force | Age 45-54
In Labor Force | Age 45-54 Comparison
Central American Indians
Immigrants from Uzbekistan
80.0%
IN LABOR FORCE | AGE 45-54
0.0/ 100
METRIC RATING
308th/ 347
METRIC RANK
82.3%
IN LABOR FORCE | AGE 45-54
5.8/ 100
METRIC RATING
213th/ 347
METRIC RANK
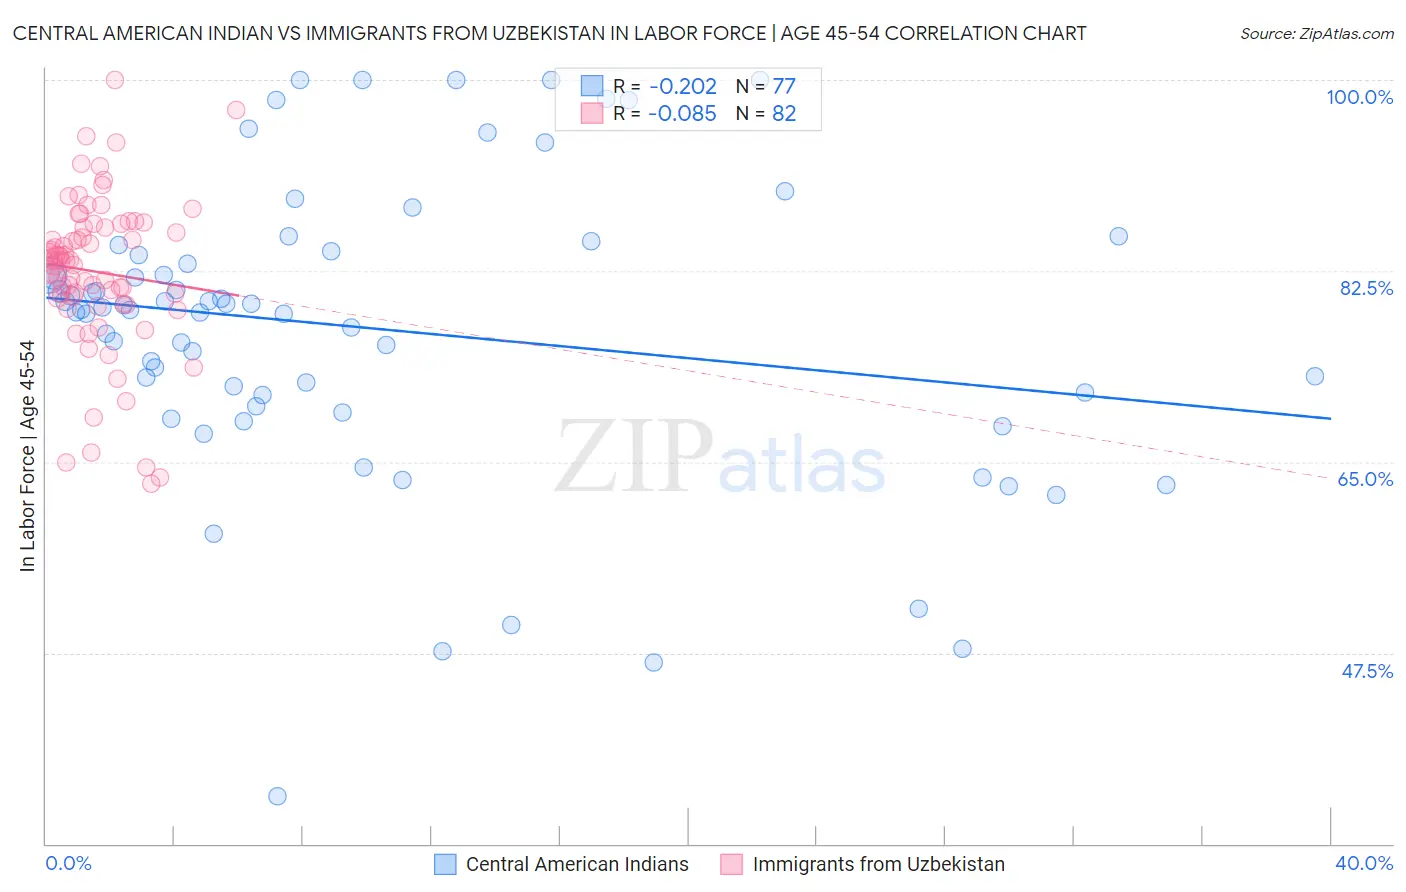
Central American Indian vs Immigrants from Uzbekistan In Labor Force | Age 45-54 Correlation Chart
The statistical analysis conducted on geographies consisting of 326,071,382 people shows a weak negative correlation between the proportion of Central American Indians and labor force participation rate among population between the ages 45 and 54 in the United States with a correlation coefficient (R) of -0.202 and weighted average of 80.0%. Similarly, the statistical analysis conducted on geographies consisting of 118,730,775 people shows a slight negative correlation between the proportion of Immigrants from Uzbekistan and labor force participation rate among population between the ages 45 and 54 in the United States with a correlation coefficient (R) of -0.085 and weighted average of 82.3%, a difference of 2.9%.
In Labor Force | Age 45-54 Correlation Summary
| Measurement | Central American Indian | Immigrants from Uzbekistan |
| Minimum | 34.3% | 63.0% |
| Maximum | 100.0% | 100.0% |
| Range | 65.7% | 37.0% |
| Mean | 77.2% | 82.4% |
| Median | 78.9% | 83.5% |
| Interquartile 25% (IQ1) | 70.6% | 80.0% |
| Interquartile 75% (IQ3) | 84.1% | 86.5% |
| Interquartile Range (IQR) | 13.5% | 6.5% |
| Standard Deviation (Sample) | 13.6% | 7.1% |
| Standard Deviation (Population) | 13.5% | 7.1% |
Similar Demographics by In Labor Force | Age 45-54
Demographics Similar to Central American Indians by In Labor Force | Age 45-54
In terms of in labor force | age 45-54, the demographic groups most similar to Central American Indians are Potawatomi (80.0%, a difference of 0.030%), Blackfeet (80.0%, a difference of 0.040%), Spanish American (80.1%, a difference of 0.12%), Inupiat (79.9%, a difference of 0.12%), and Hispanic or Latino (80.1%, a difference of 0.16%).
| Demographics | Rating | Rank | In Labor Force | Age 45-54 |
| Spanish American Indians | 0.0 /100 | #301 | Tragic 80.2% |
| Immigrants | Central America | 0.0 /100 | #302 | Tragic 80.2% |
| Immigrants | Azores | 0.0 /100 | #303 | Tragic 80.1% |
| Hispanics or Latinos | 0.0 /100 | #304 | Tragic 80.1% |
| Immigrants | Dominican Republic | 0.0 /100 | #305 | Tragic 80.1% |
| Spanish Americans | 0.0 /100 | #306 | Tragic 80.1% |
| Blackfeet | 0.0 /100 | #307 | Tragic 80.0% |
| Central American Indians | 0.0 /100 | #308 | Tragic 80.0% |
| Potawatomi | 0.0 /100 | #309 | Tragic 80.0% |
| Inupiat | 0.0 /100 | #310 | Tragic 79.9% |
| Mexicans | 0.0 /100 | #311 | Tragic 79.8% |
| Immigrants | Mexico | 0.0 /100 | #312 | Tragic 79.7% |
| Colville | 0.0 /100 | #313 | Tragic 79.5% |
| Ottawa | 0.0 /100 | #314 | Tragic 79.5% |
| Blacks/African Americans | 0.0 /100 | #315 | Tragic 79.3% |
Demographics Similar to Immigrants from Uzbekistan by In Labor Force | Age 45-54
In terms of in labor force | age 45-54, the demographic groups most similar to Immigrants from Uzbekistan are Immigrants from Panama (82.2%, a difference of 0.010%), Iraqi (82.2%, a difference of 0.010%), Ecuadorian (82.3%, a difference of 0.020%), Scottish (82.2%, a difference of 0.020%), and Immigrants from Syria (82.3%, a difference of 0.030%).
| Demographics | Rating | Rank | In Labor Force | Age 45-54 |
| Welsh | 9.2 /100 | #206 | Tragic 82.3% |
| Immigrants | Cabo Verde | 8.6 /100 | #207 | Tragic 82.3% |
| Native Hawaiians | 8.5 /100 | #208 | Tragic 82.3% |
| Immigrants | Lebanon | 7.4 /100 | #209 | Tragic 82.3% |
| Immigrants | Bahamas | 7.1 /100 | #210 | Tragic 82.3% |
| Immigrants | Syria | 6.6 /100 | #211 | Tragic 82.3% |
| Ecuadorians | 6.3 /100 | #212 | Tragic 82.3% |
| Immigrants | Uzbekistan | 5.8 /100 | #213 | Tragic 82.3% |
| Immigrants | Panama | 5.6 /100 | #214 | Tragic 82.2% |
| Iraqis | 5.6 /100 | #215 | Tragic 82.2% |
| Scottish | 5.3 /100 | #216 | Tragic 82.2% |
| Portuguese | 4.7 /100 | #217 | Tragic 82.2% |
| English | 4.4 /100 | #218 | Tragic 82.2% |
| French | 4.1 /100 | #219 | Tragic 82.2% |
| Bahamians | 3.6 /100 | #220 | Tragic 82.2% |