Central American Indian vs Hopi In Labor Force | Age 45-54
COMPARE
Central American Indian
Hopi
In Labor Force | Age 45-54
In Labor Force | Age 45-54 Comparison
Central American Indians
Hopi
80.0%
IN LABOR FORCE | AGE 45-54
0.0/ 100
METRIC RATING
308th/ 347
METRIC RANK
75.0%
IN LABOR FORCE | AGE 45-54
0.0/ 100
METRIC RATING
343rd/ 347
METRIC RANK
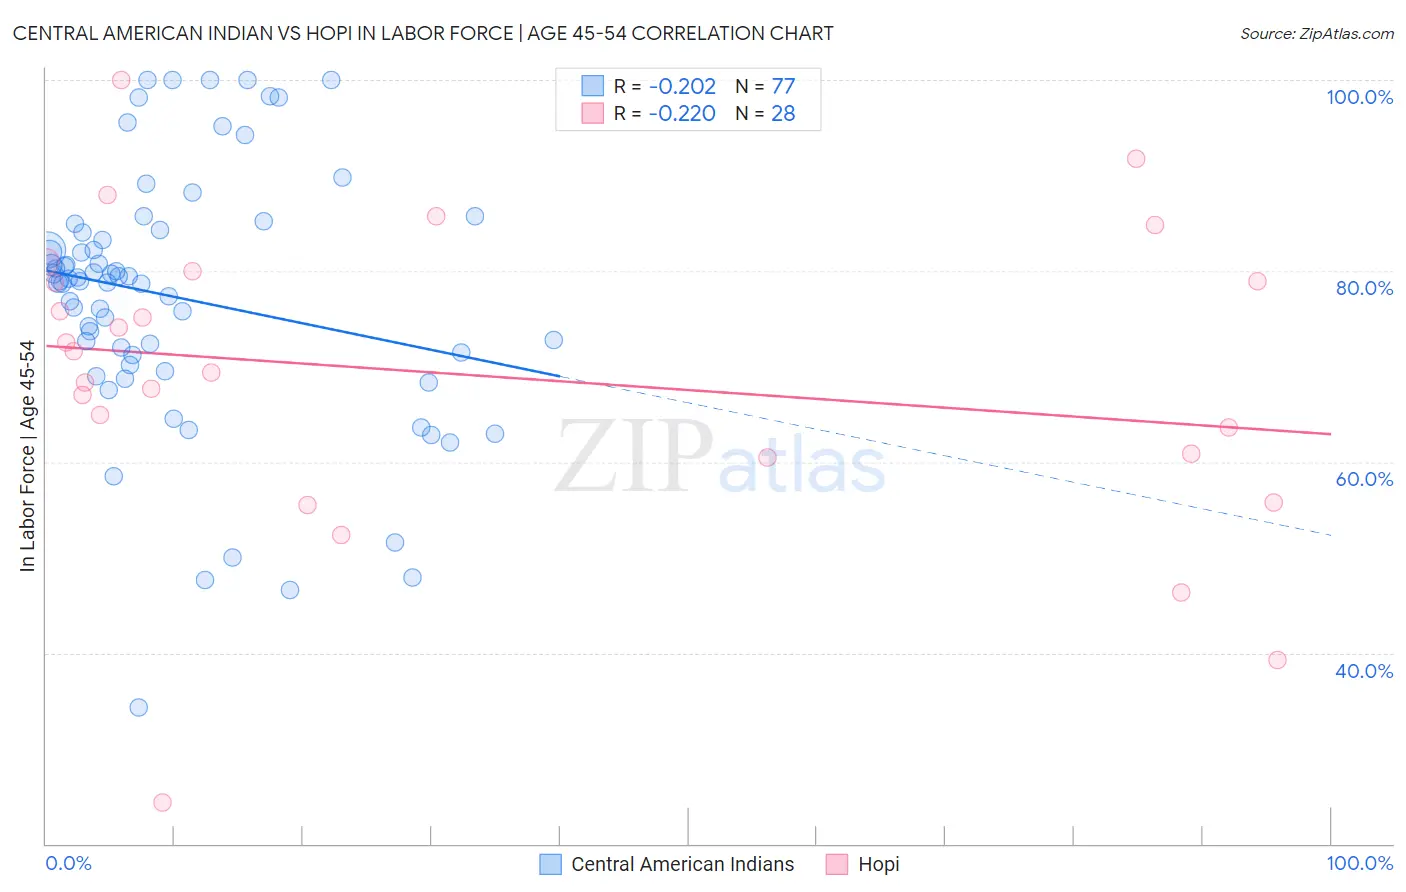
Central American Indian vs Hopi In Labor Force | Age 45-54 Correlation Chart
The statistical analysis conducted on geographies consisting of 326,071,382 people shows a weak negative correlation between the proportion of Central American Indians and labor force participation rate among population between the ages 45 and 54 in the United States with a correlation coefficient (R) of -0.202 and weighted average of 80.0%. Similarly, the statistical analysis conducted on geographies consisting of 74,732,664 people shows a weak negative correlation between the proportion of Hopi and labor force participation rate among population between the ages 45 and 54 in the United States with a correlation coefficient (R) of -0.220 and weighted average of 75.0%, a difference of 6.6%.
In Labor Force | Age 45-54 Correlation Summary
| Measurement | Central American Indian | Hopi |
| Minimum | 34.3% | 24.3% |
| Maximum | 100.0% | 100.0% |
| Range | 65.7% | 75.7% |
| Mean | 77.2% | 69.1% |
| Median | 78.9% | 70.4% |
| Interquartile 25% (IQ1) | 70.6% | 60.7% |
| Interquartile 75% (IQ3) | 84.1% | 79.4% |
| Interquartile Range (IQR) | 13.5% | 18.8% |
| Standard Deviation (Sample) | 13.6% | 16.3% |
| Standard Deviation (Population) | 13.5% | 16.0% |
Similar Demographics by In Labor Force | Age 45-54
Demographics Similar to Central American Indians by In Labor Force | Age 45-54
In terms of in labor force | age 45-54, the demographic groups most similar to Central American Indians are Potawatomi (80.0%, a difference of 0.030%), Blackfeet (80.0%, a difference of 0.040%), Spanish American (80.1%, a difference of 0.12%), Inupiat (79.9%, a difference of 0.12%), and Hispanic or Latino (80.1%, a difference of 0.16%).
| Demographics | Rating | Rank | In Labor Force | Age 45-54 |
| Spanish American Indians | 0.0 /100 | #301 | Tragic 80.2% |
| Immigrants | Central America | 0.0 /100 | #302 | Tragic 80.2% |
| Immigrants | Azores | 0.0 /100 | #303 | Tragic 80.1% |
| Hispanics or Latinos | 0.0 /100 | #304 | Tragic 80.1% |
| Immigrants | Dominican Republic | 0.0 /100 | #305 | Tragic 80.1% |
| Spanish Americans | 0.0 /100 | #306 | Tragic 80.1% |
| Blackfeet | 0.0 /100 | #307 | Tragic 80.0% |
| Central American Indians | 0.0 /100 | #308 | Tragic 80.0% |
| Potawatomi | 0.0 /100 | #309 | Tragic 80.0% |
| Inupiat | 0.0 /100 | #310 | Tragic 79.9% |
| Mexicans | 0.0 /100 | #311 | Tragic 79.8% |
| Immigrants | Mexico | 0.0 /100 | #312 | Tragic 79.7% |
| Colville | 0.0 /100 | #313 | Tragic 79.5% |
| Ottawa | 0.0 /100 | #314 | Tragic 79.5% |
| Blacks/African Americans | 0.0 /100 | #315 | Tragic 79.3% |
Demographics Similar to Hopi by In Labor Force | Age 45-54
In terms of in labor force | age 45-54, the demographic groups most similar to Hopi are Tohono O'odham (75.1%, a difference of 0.18%), Pueblo (75.5%, a difference of 0.67%), Immigrants from Yemen (74.4%, a difference of 0.78%), Lumbee (75.6%, a difference of 0.79%), and Puerto Rican (75.9%, a difference of 1.3%).
| Demographics | Rating | Rank | In Labor Force | Age 45-54 |
| Natives/Alaskans | 0.0 /100 | #333 | Tragic 77.1% |
| Apache | 0.0 /100 | #334 | Tragic 77.1% |
| Arapaho | 0.0 /100 | #335 | Tragic 77.1% |
| Paiute | 0.0 /100 | #336 | Tragic 76.7% |
| Ute | 0.0 /100 | #337 | Tragic 76.6% |
| Yuman | 0.0 /100 | #338 | Tragic 76.3% |
| Puerto Ricans | 0.0 /100 | #339 | Tragic 75.9% |
| Lumbee | 0.0 /100 | #340 | Tragic 75.6% |
| Pueblo | 0.0 /100 | #341 | Tragic 75.5% |
| Tohono O'odham | 0.0 /100 | #342 | Tragic 75.1% |
| Hopi | 0.0 /100 | #343 | Tragic 75.0% |
| Immigrants | Yemen | 0.0 /100 | #344 | Tragic 74.4% |
| Houma | 0.0 /100 | #345 | Tragic 74.1% |
| Pima | 0.0 /100 | #346 | Tragic 72.8% |
| Navajo | 0.0 /100 | #347 | Tragic 72.8% |