Navajo vs Hopi Single Female Poverty
COMPARE
Navajo
Hopi
Single Female Poverty
Single Female Poverty Comparison
Navajo
Hopi
31.7%
SINGLE FEMALE POVERTY
0.0/ 100
METRIC RATING
342nd/ 347
METRIC RANK
28.0%
SINGLE FEMALE POVERTY
0.0/ 100
METRIC RATING
330th/ 347
METRIC RANK
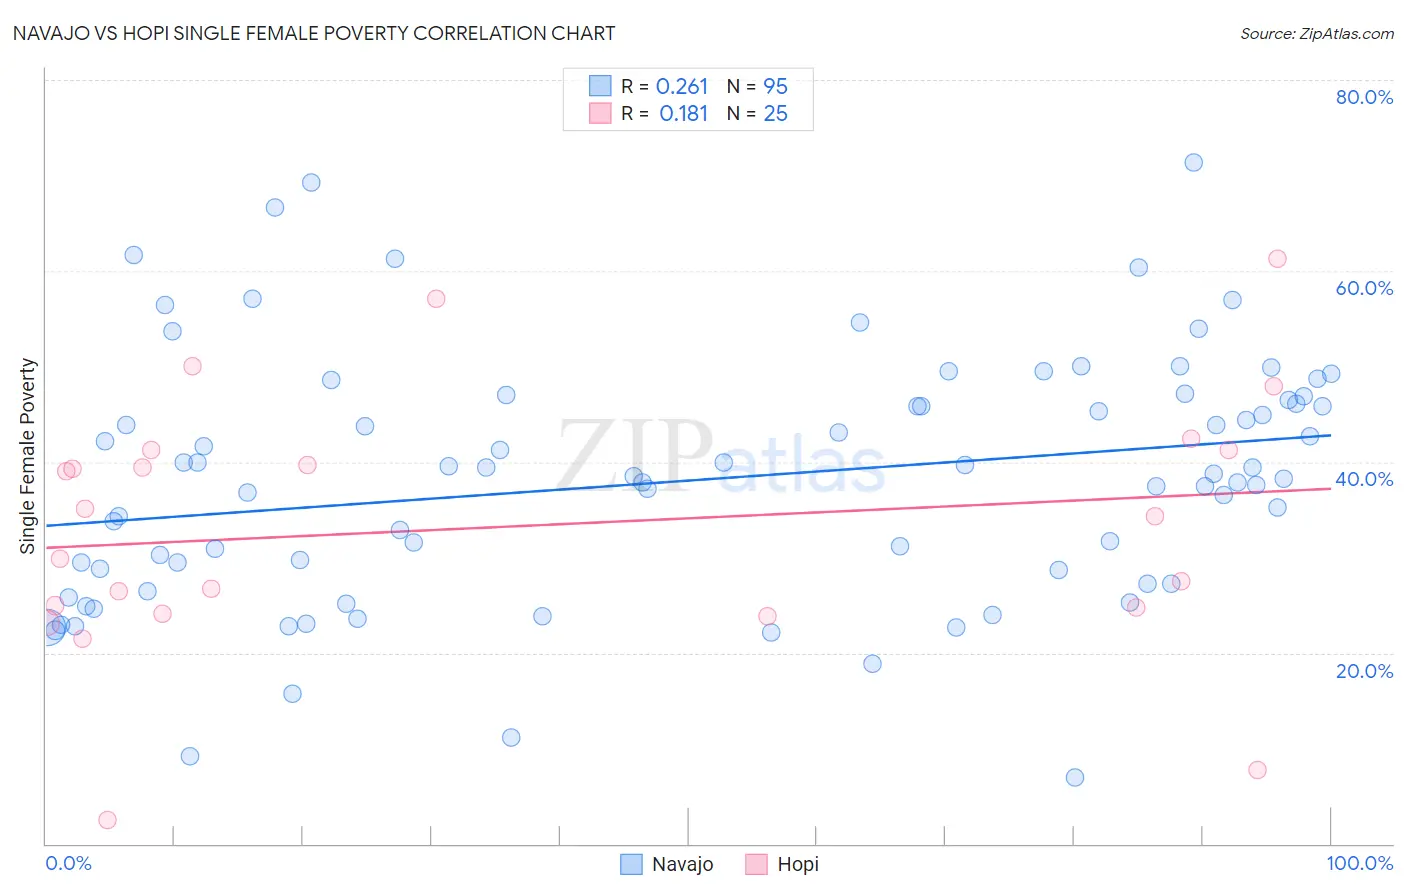
Navajo vs Hopi Single Female Poverty Correlation Chart
The statistical analysis conducted on geographies consisting of 223,343,663 people shows a weak positive correlation between the proportion of Navajo and poverty level among single females in the United States with a correlation coefficient (R) of 0.261 and weighted average of 31.7%. Similarly, the statistical analysis conducted on geographies consisting of 74,526,987 people shows a poor positive correlation between the proportion of Hopi and poverty level among single females in the United States with a correlation coefficient (R) of 0.181 and weighted average of 28.0%, a difference of 12.9%.
Single Female Poverty Correlation Summary
| Measurement | Navajo | Hopi |
| Minimum | 7.0% | 2.4% |
| Maximum | 71.4% | 61.3% |
| Range | 64.4% | 58.9% |
| Mean | 38.1% | 33.2% |
| Median | 38.5% | 34.3% |
| Interquartile 25% (IQ1) | 27.3% | 24.4% |
| Interquartile 75% (IQ3) | 46.5% | 41.2% |
| Interquartile Range (IQR) | 19.3% | 16.8% |
| Standard Deviation (Sample) | 13.1% | 13.7% |
| Standard Deviation (Population) | 13.0% | 13.4% |
Demographics Similar to Navajo and Hopi by Single Female Poverty
In terms of single female poverty, the demographic groups most similar to Navajo are Sioux (31.3%, a difference of 1.3%), Crow (32.4%, a difference of 2.4%), Cajun (30.6%, a difference of 3.3%), Cheyenne (30.4%, a difference of 4.1%), and Lumbee (33.0%, a difference of 4.3%). Similarly, the demographic groups most similar to Hopi are Native/Alaskan (28.2%, a difference of 0.64%), Menominee (27.8%, a difference of 0.71%), Yakama (28.3%, a difference of 0.90%), Apache (27.7%, a difference of 1.2%), and Ute (28.4%, a difference of 1.3%).
| Demographics | Rating | Rank | Single Female Poverty |
| Creek | 0.0 /100 | #326 | Tragic 27.4% |
| Dutch West Indians | 0.0 /100 | #327 | Tragic 27.5% |
| Apache | 0.0 /100 | #328 | Tragic 27.7% |
| Menominee | 0.0 /100 | #329 | Tragic 27.8% |
| Hopi | 0.0 /100 | #330 | Tragic 28.0% |
| Natives/Alaskans | 0.0 /100 | #331 | Tragic 28.2% |
| Yakama | 0.0 /100 | #332 | Tragic 28.3% |
| Ute | 0.0 /100 | #333 | Tragic 28.4% |
| Pueblo | 0.0 /100 | #334 | Tragic 28.6% |
| Immigrants | Yemen | 0.0 /100 | #335 | Tragic 28.9% |
| Colville | 0.0 /100 | #336 | Tragic 29.1% |
| Yuman | 0.0 /100 | #337 | Tragic 29.4% |
| Pima | 0.0 /100 | #338 | Tragic 30.3% |
| Cheyenne | 0.0 /100 | #339 | Tragic 30.4% |
| Cajuns | 0.0 /100 | #340 | Tragic 30.6% |
| Sioux | 0.0 /100 | #341 | Tragic 31.3% |
| Navajo | 0.0 /100 | #342 | Tragic 31.7% |
| Crow | 0.0 /100 | #343 | Tragic 32.4% |
| Lumbee | 0.0 /100 | #344 | Tragic 33.0% |
| Houma | 0.0 /100 | #345 | Tragic 33.8% |
| Puerto Ricans | 0.0 /100 | #346 | Tragic 34.1% |