Central American Indian vs Hopi Householder Income Ages 45 - 64 years
COMPARE
Central American Indian
Hopi
Householder Income Ages 45 - 64 years
Householder Income Ages 45 - 64 years Comparison
Central American Indians
Hopi
$86,764
HOUSEHOLDER INCOME AGES 45 - 64 YEARS
0.1/ 100
METRIC RATING
284th/ 347
METRIC RANK
$75,562
HOUSEHOLDER INCOME AGES 45 - 64 YEARS
0.0/ 100
METRIC RATING
338th/ 347
METRIC RANK
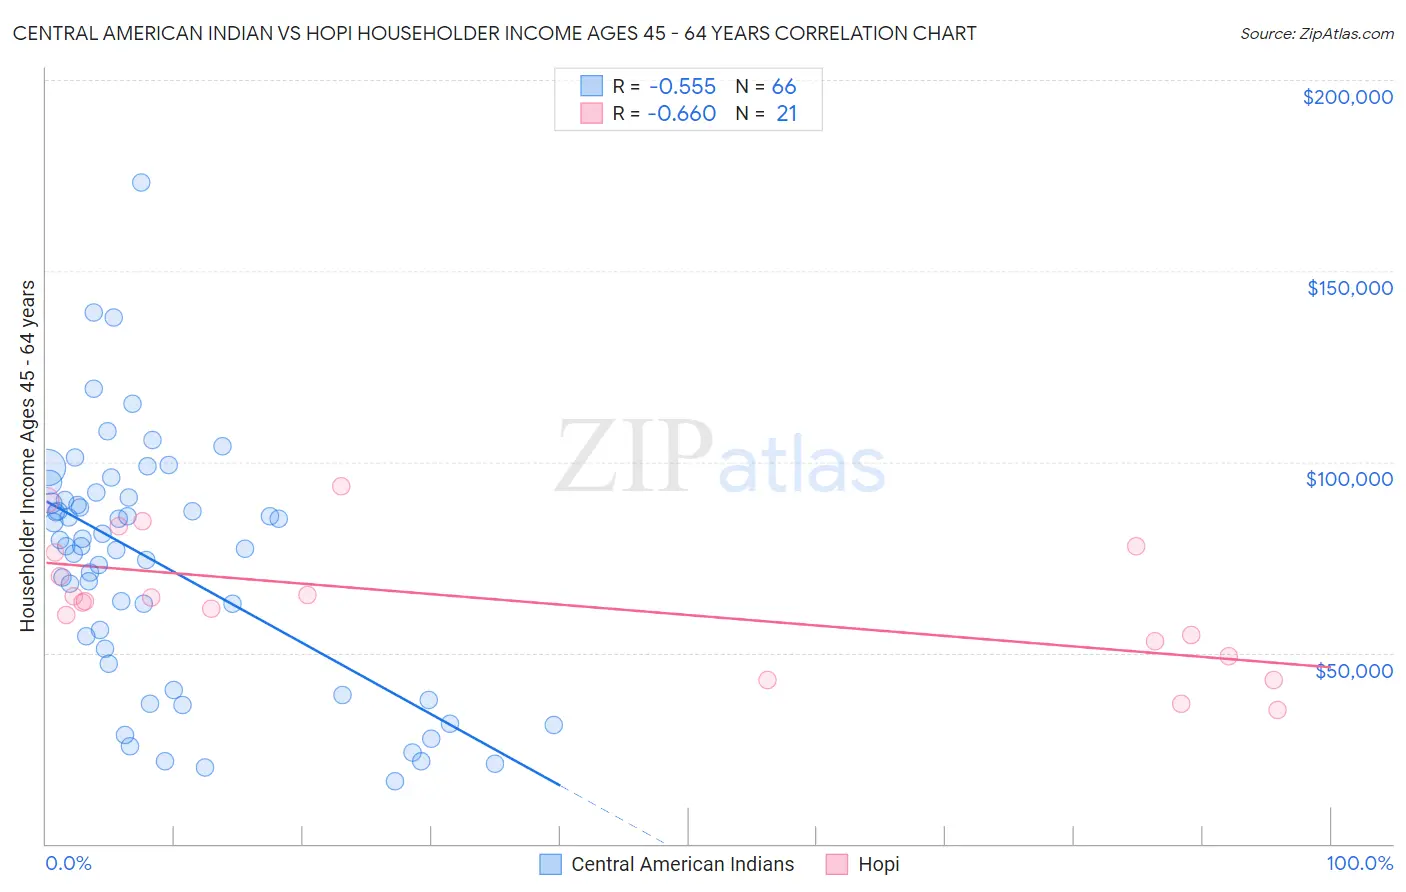
Central American Indian vs Hopi Householder Income Ages 45 - 64 years Correlation Chart
The statistical analysis conducted on geographies consisting of 325,794,243 people shows a substantial negative correlation between the proportion of Central American Indians and household income with householder between the ages 45 and 64 in the United States with a correlation coefficient (R) of -0.555 and weighted average of $86,764. Similarly, the statistical analysis conducted on geographies consisting of 74,685,429 people shows a significant negative correlation between the proportion of Hopi and household income with householder between the ages 45 and 64 in the United States with a correlation coefficient (R) of -0.660 and weighted average of $75,562, a difference of 14.8%.
Householder Income Ages 45 - 64 years Correlation Summary
| Measurement | Central American Indian | Hopi |
| Minimum | $16,412 | $34,950 |
| Maximum | $173,000 | $93,766 |
| Range | $156,588 | $58,816 |
| Mean | $72,864 | $63,454 |
| Median | $78,027 | $63,663 |
| Interquartile 25% (IQ1) | $47,059 | $51,066 |
| Interquartile 75% (IQ3) | $90,095 | $76,979 |
| Interquartile Range (IQR) | $43,036 | $25,913 |
| Standard Deviation (Sample) | $32,226 | $16,805 |
| Standard Deviation (Population) | $31,981 | $16,400 |
Similar Demographics by Householder Income Ages 45 - 64 years
Demographics Similar to Central American Indians by Householder Income Ages 45 - 64 years
In terms of householder income ages 45 - 64 years, the demographic groups most similar to Central American Indians are Mexican ($86,816, a difference of 0.060%), Senegalese ($86,897, a difference of 0.15%), Yaqui ($86,914, a difference of 0.17%), Blackfeet ($86,595, a difference of 0.20%), and Immigrants from Guatemala ($86,573, a difference of 0.22%).
| Demographics | Rating | Rank | Householder Income Ages 45 - 64 years |
| Cree | 0.1 /100 | #277 | Tragic $87,185 |
| Immigrants | Jamaica | 0.1 /100 | #278 | Tragic $87,035 |
| Yakama | 0.1 /100 | #279 | Tragic $86,992 |
| Immigrants | Somalia | 0.1 /100 | #280 | Tragic $86,987 |
| Yaqui | 0.1 /100 | #281 | Tragic $86,914 |
| Senegalese | 0.1 /100 | #282 | Tragic $86,897 |
| Mexicans | 0.1 /100 | #283 | Tragic $86,816 |
| Central American Indians | 0.1 /100 | #284 | Tragic $86,764 |
| Blackfeet | 0.1 /100 | #285 | Tragic $86,595 |
| Immigrants | Guatemala | 0.1 /100 | #286 | Tragic $86,573 |
| Bangladeshis | 0.1 /100 | #287 | Tragic $86,402 |
| Immigrants | St. Vincent and the Grenadines | 0.1 /100 | #288 | Tragic $86,394 |
| Cubans | 0.1 /100 | #289 | Tragic $86,301 |
| Cherokee | 0.1 /100 | #290 | Tragic $86,125 |
| Hispanics or Latinos | 0.1 /100 | #291 | Tragic $86,006 |
Demographics Similar to Hopi by Householder Income Ages 45 - 64 years
In terms of householder income ages 45 - 64 years, the demographic groups most similar to Hopi are Pueblo ($75,601, a difference of 0.050%), Arapaho ($75,945, a difference of 0.51%), Kiowa ($74,815, a difference of 1.0%), Cheyenne ($76,362, a difference of 1.1%), and Immigrants from Yemen ($74,575, a difference of 1.3%).
| Demographics | Rating | Rank | Householder Income Ages 45 - 64 years |
| Immigrants | Dominican Republic | 0.0 /100 | #331 | Tragic $78,836 |
| Blacks/African Americans | 0.0 /100 | #332 | Tragic $78,556 |
| Immigrants | Congo | 0.0 /100 | #333 | Tragic $77,850 |
| Menominee | 0.0 /100 | #334 | Tragic $76,903 |
| Cheyenne | 0.0 /100 | #335 | Tragic $76,362 |
| Arapaho | 0.0 /100 | #336 | Tragic $75,945 |
| Pueblo | 0.0 /100 | #337 | Tragic $75,601 |
| Hopi | 0.0 /100 | #338 | Tragic $75,562 |
| Kiowa | 0.0 /100 | #339 | Tragic $74,815 |
| Immigrants | Yemen | 0.0 /100 | #340 | Tragic $74,575 |
| Crow | 0.0 /100 | #341 | Tragic $74,257 |
| Tohono O'odham | 0.0 /100 | #342 | Tragic $73,774 |
| Pima | 0.0 /100 | #343 | Tragic $73,365 |
| Houma | 0.0 /100 | #344 | Tragic $72,093 |
| Navajo | 0.0 /100 | #345 | Tragic $69,759 |