Ecuadorian vs Hopi Single Female Poverty
COMPARE
Ecuadorian
Hopi
Single Female Poverty
Single Female Poverty Comparison
Ecuadorians
Hopi
21.6%
SINGLE FEMALE POVERTY
12.3/ 100
METRIC RATING
215th/ 347
METRIC RANK
28.0%
SINGLE FEMALE POVERTY
0.0/ 100
METRIC RATING
330th/ 347
METRIC RANK
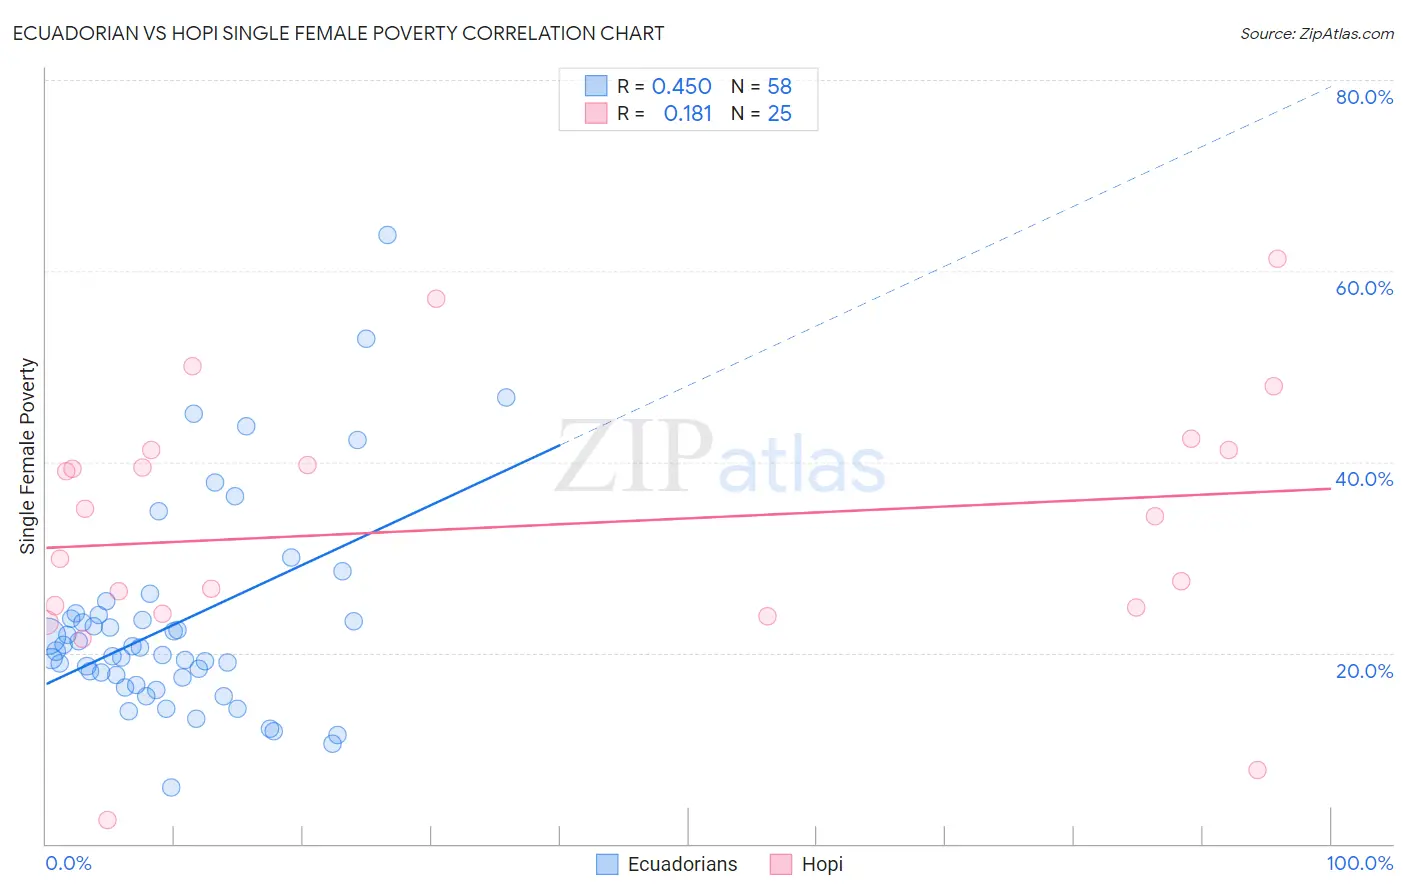
Ecuadorian vs Hopi Single Female Poverty Correlation Chart
The statistical analysis conducted on geographies consisting of 313,951,403 people shows a moderate positive correlation between the proportion of Ecuadorians and poverty level among single females in the United States with a correlation coefficient (R) of 0.450 and weighted average of 21.6%. Similarly, the statistical analysis conducted on geographies consisting of 74,526,987 people shows a poor positive correlation between the proportion of Hopi and poverty level among single females in the United States with a correlation coefficient (R) of 0.181 and weighted average of 28.0%, a difference of 29.5%.
Single Female Poverty Correlation Summary
| Measurement | Ecuadorian | Hopi |
| Minimum | 5.9% | 2.4% |
| Maximum | 63.8% | 61.3% |
| Range | 57.9% | 58.9% |
| Mean | 23.1% | 33.2% |
| Median | 20.4% | 34.3% |
| Interquartile 25% (IQ1) | 17.5% | 24.4% |
| Interquartile 75% (IQ3) | 24.0% | 41.2% |
| Interquartile Range (IQR) | 6.5% | 16.8% |
| Standard Deviation (Sample) | 10.9% | 13.7% |
| Standard Deviation (Population) | 10.8% | 13.4% |
Similar Demographics by Single Female Poverty
Demographics Similar to Ecuadorians by Single Female Poverty
In terms of single female poverty, the demographic groups most similar to Ecuadorians are Immigrants from Barbados (21.7%, a difference of 0.020%), Immigrants from St. Vincent and the Grenadines (21.7%, a difference of 0.090%), Immigrants from Nicaragua (21.6%, a difference of 0.13%), Guamanian/Chamorro (21.6%, a difference of 0.19%), and Jamaican (21.6%, a difference of 0.22%).
| Demographics | Rating | Rank | Single Female Poverty |
| Haitians | 15.4 /100 | #208 | Poor 21.6% |
| Immigrants | Eastern Africa | 15.1 /100 | #209 | Poor 21.6% |
| Immigrants | Panama | 14.4 /100 | #210 | Poor 21.6% |
| Icelanders | 14.0 /100 | #211 | Poor 21.6% |
| Jamaicans | 14.0 /100 | #212 | Poor 21.6% |
| Guamanians/Chamorros | 13.7 /100 | #213 | Poor 21.6% |
| Immigrants | Nicaragua | 13.3 /100 | #214 | Poor 21.6% |
| Ecuadorians | 12.3 /100 | #215 | Poor 21.6% |
| Immigrants | Barbados | 12.2 /100 | #216 | Poor 21.7% |
| Immigrants | St. Vincent and the Grenadines | 11.7 /100 | #217 | Poor 21.7% |
| Nepalese | 9.7 /100 | #218 | Tragic 21.7% |
| Panamanians | 9.4 /100 | #219 | Tragic 21.7% |
| Germans | 8.3 /100 | #220 | Tragic 21.8% |
| Immigrants | Grenada | 8.0 /100 | #221 | Tragic 21.8% |
| Immigrants | Eritrea | 7.9 /100 | #222 | Tragic 21.8% |
Demographics Similar to Hopi by Single Female Poverty
In terms of single female poverty, the demographic groups most similar to Hopi are Native/Alaskan (28.2%, a difference of 0.64%), Menominee (27.8%, a difference of 0.71%), Yakama (28.3%, a difference of 0.90%), Apache (27.7%, a difference of 1.2%), and Ute (28.4%, a difference of 1.3%).
| Demographics | Rating | Rank | Single Female Poverty |
| Chippewa | 0.0 /100 | #323 | Tragic 26.8% |
| Kiowa | 0.0 /100 | #324 | Tragic 26.9% |
| Choctaw | 0.0 /100 | #325 | Tragic 27.2% |
| Creek | 0.0 /100 | #326 | Tragic 27.4% |
| Dutch West Indians | 0.0 /100 | #327 | Tragic 27.5% |
| Apache | 0.0 /100 | #328 | Tragic 27.7% |
| Menominee | 0.0 /100 | #329 | Tragic 27.8% |
| Hopi | 0.0 /100 | #330 | Tragic 28.0% |
| Natives/Alaskans | 0.0 /100 | #331 | Tragic 28.2% |
| Yakama | 0.0 /100 | #332 | Tragic 28.3% |
| Ute | 0.0 /100 | #333 | Tragic 28.4% |
| Pueblo | 0.0 /100 | #334 | Tragic 28.6% |
| Immigrants | Yemen | 0.0 /100 | #335 | Tragic 28.9% |
| Colville | 0.0 /100 | #336 | Tragic 29.1% |
| Yuman | 0.0 /100 | #337 | Tragic 29.4% |