Argentinean vs Chickasaw Female Poverty
COMPARE
Argentinean
Chickasaw
Female Poverty
Female Poverty Comparison
Argentineans
Chickasaw
12.8%
FEMALE POVERTY
89.1/ 100
METRIC RATING
125th/ 347
METRIC RANK
15.9%
FEMALE POVERTY
0.1/ 100
METRIC RATING
270th/ 347
METRIC RANK
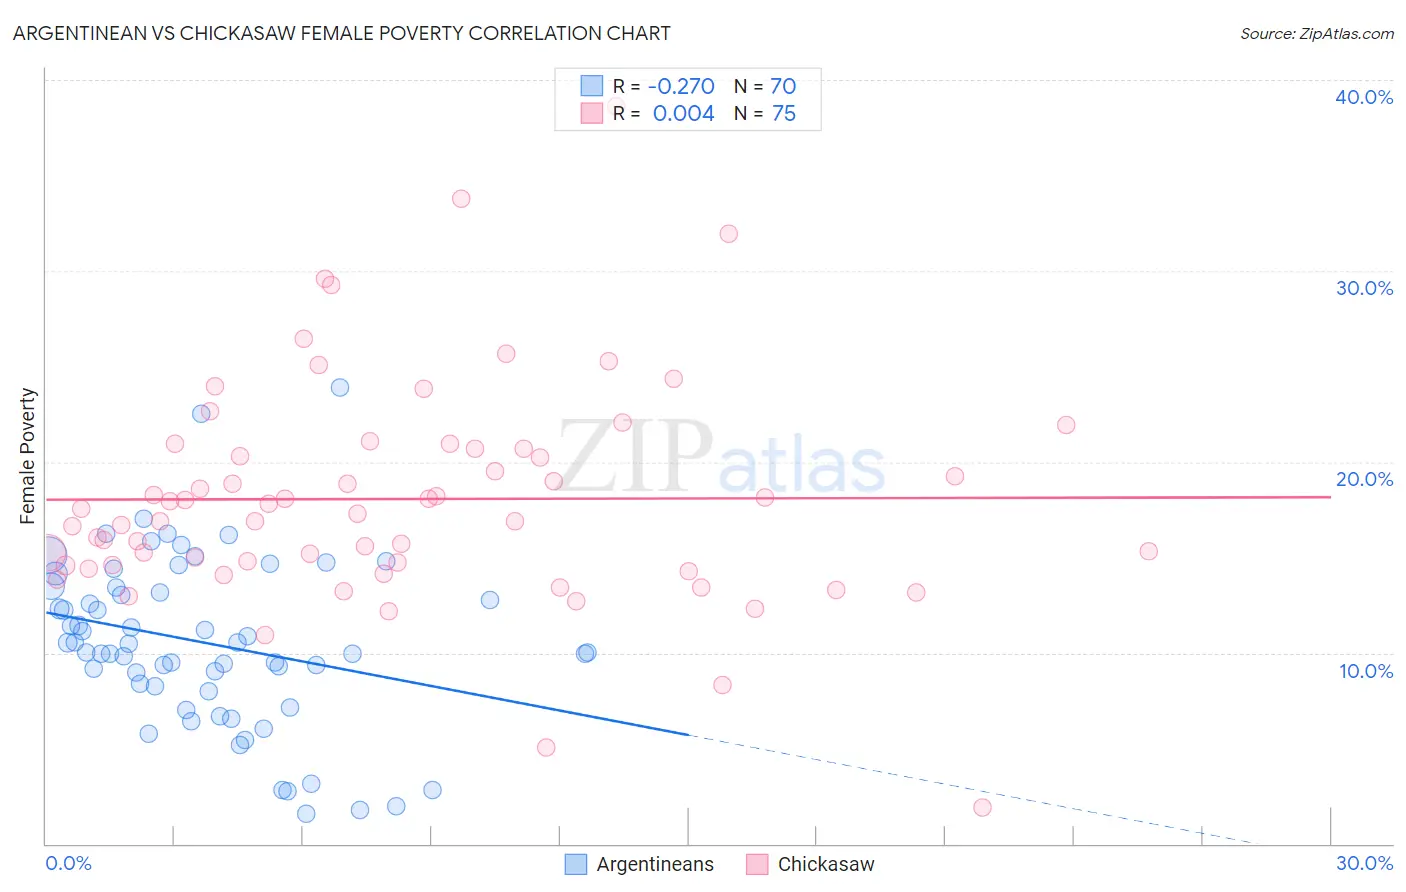
Argentinean vs Chickasaw Female Poverty Correlation Chart
The statistical analysis conducted on geographies consisting of 296,942,880 people shows a weak negative correlation between the proportion of Argentineans and poverty level among females in the United States with a correlation coefficient (R) of -0.270 and weighted average of 12.8%. Similarly, the statistical analysis conducted on geographies consisting of 147,658,289 people shows no correlation between the proportion of Chickasaw and poverty level among females in the United States with a correlation coefficient (R) of 0.004 and weighted average of 15.9%, a difference of 24.3%.
Female Poverty Correlation Summary
| Measurement | Argentinean | Chickasaw |
| Minimum | 1.6% | 1.9% |
| Maximum | 23.9% | 38.6% |
| Range | 22.4% | 36.7% |
| Mean | 10.5% | 18.1% |
| Median | 10.2% | 17.3% |
| Interquartile 25% (IQ1) | 8.3% | 14.6% |
| Interquartile 75% (IQ3) | 13.4% | 20.7% |
| Interquartile Range (IQR) | 5.2% | 6.1% |
| Standard Deviation (Sample) | 4.5% | 5.9% |
| Standard Deviation (Population) | 4.4% | 5.9% |
Similar Demographics by Female Poverty
Demographics Similar to Argentineans by Female Poverty
In terms of female poverty, the demographic groups most similar to Argentineans are Immigrants from Norway (12.8%, a difference of 0.050%), Immigrants from Ukraine (12.8%, a difference of 0.070%), South African (12.8%, a difference of 0.18%), Immigrants from Belarus (12.8%, a difference of 0.22%), and Immigrants from South Eastern Asia (12.7%, a difference of 0.23%).
| Demographics | Rating | Rank | Female Poverty |
| Sri Lankans | 90.9 /100 | #118 | Exceptional 12.7% |
| Albanians | 90.8 /100 | #119 | Exceptional 12.7% |
| New Zealanders | 90.6 /100 | #120 | Exceptional 12.7% |
| Immigrants | Hungary | 90.3 /100 | #121 | Exceptional 12.7% |
| French Canadians | 90.2 /100 | #122 | Exceptional 12.7% |
| Immigrants | South Eastern Asia | 89.9 /100 | #123 | Excellent 12.7% |
| Immigrants | Norway | 89.3 /100 | #124 | Excellent 12.8% |
| Argentineans | 89.1 /100 | #125 | Excellent 12.8% |
| Immigrants | Ukraine | 88.8 /100 | #126 | Excellent 12.8% |
| South Africans | 88.4 /100 | #127 | Excellent 12.8% |
| Immigrants | Belarus | 88.2 /100 | #128 | Excellent 12.8% |
| Immigrants | Brazil | 87.9 /100 | #129 | Excellent 12.8% |
| Immigrants | Vietnam | 87.1 /100 | #130 | Excellent 12.8% |
| Immigrants | Argentina | 87.0 /100 | #131 | Excellent 12.8% |
| Immigrants | Jordan | 86.9 /100 | #132 | Excellent 12.8% |
Demographics Similar to Chickasaw by Female Poverty
In terms of female poverty, the demographic groups most similar to Chickasaw are Iroquois (15.8%, a difference of 0.26%), Immigrants from St. Vincent and the Grenadines (15.9%, a difference of 0.28%), Belizean (15.9%, a difference of 0.50%), Haitian (15.9%, a difference of 0.51%), and Barbadian (15.9%, a difference of 0.51%).
| Demographics | Rating | Rank | Female Poverty |
| Cherokee | 0.1 /100 | #263 | Tragic 15.6% |
| Immigrants | Ecuador | 0.1 /100 | #264 | Tragic 15.6% |
| Immigrants | Liberia | 0.1 /100 | #265 | Tragic 15.7% |
| Immigrants | El Salvador | 0.1 /100 | #266 | Tragic 15.7% |
| Sub-Saharan Africans | 0.1 /100 | #267 | Tragic 15.8% |
| Immigrants | Nicaragua | 0.1 /100 | #268 | Tragic 15.8% |
| Iroquois | 0.1 /100 | #269 | Tragic 15.8% |
| Chickasaw | 0.1 /100 | #270 | Tragic 15.9% |
| Immigrants | St. Vincent and the Grenadines | 0.0 /100 | #271 | Tragic 15.9% |
| Belizeans | 0.0 /100 | #272 | Tragic 15.9% |
| Haitians | 0.0 /100 | #273 | Tragic 15.9% |
| Barbadians | 0.0 /100 | #274 | Tragic 15.9% |
| Immigrants | Barbados | 0.0 /100 | #275 | Tragic 16.0% |
| Central Americans | 0.0 /100 | #276 | Tragic 16.0% |
| Bangladeshis | 0.0 /100 | #277 | Tragic 16.0% |