Argentinean vs Spaniard Female Poverty
COMPARE
Argentinean
Spaniard
Female Poverty
Female Poverty Comparison
Argentineans
Spaniards
12.8%
FEMALE POVERTY
89.1/ 100
METRIC RATING
125th/ 347
METRIC RANK
13.9%
FEMALE POVERTY
18.9/ 100
METRIC RATING
204th/ 347
METRIC RANK
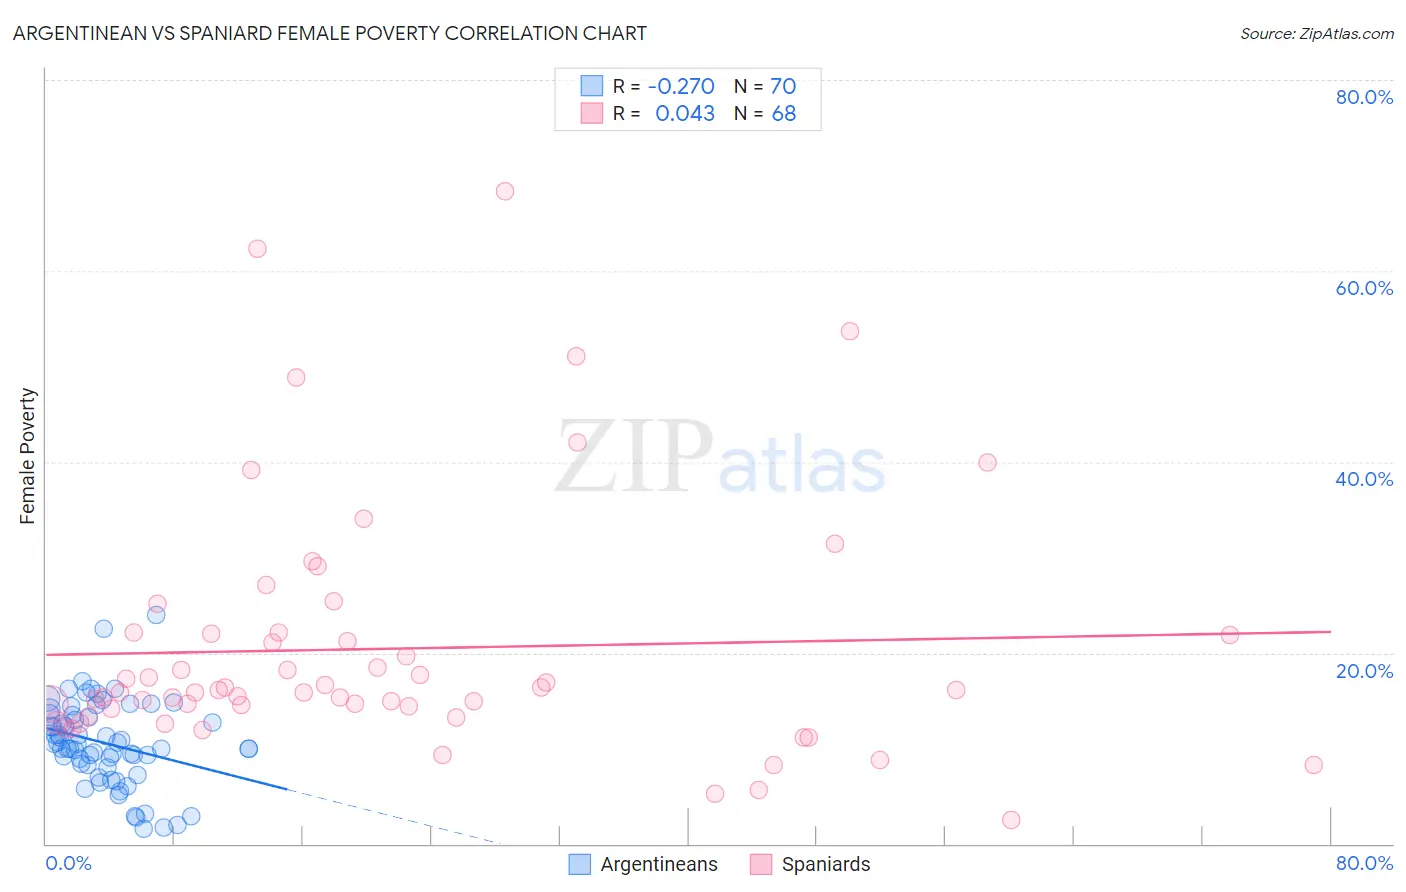
Argentinean vs Spaniard Female Poverty Correlation Chart
The statistical analysis conducted on geographies consisting of 296,942,880 people shows a weak negative correlation between the proportion of Argentineans and poverty level among females in the United States with a correlation coefficient (R) of -0.270 and weighted average of 12.8%. Similarly, the statistical analysis conducted on geographies consisting of 443,063,734 people shows no correlation between the proportion of Spaniards and poverty level among females in the United States with a correlation coefficient (R) of 0.043 and weighted average of 13.9%, a difference of 9.0%.
Female Poverty Correlation Summary
| Measurement | Argentinean | Spaniard |
| Minimum | 1.6% | 2.5% |
| Maximum | 23.9% | 68.3% |
| Range | 22.4% | 65.9% |
| Mean | 10.5% | 20.4% |
| Median | 10.2% | 15.9% |
| Interquartile 25% (IQ1) | 8.3% | 13.8% |
| Interquartile 75% (IQ3) | 13.4% | 22.0% |
| Interquartile Range (IQR) | 5.2% | 8.3% |
| Standard Deviation (Sample) | 4.5% | 13.0% |
| Standard Deviation (Population) | 4.4% | 12.9% |
Similar Demographics by Female Poverty
Demographics Similar to Argentineans by Female Poverty
In terms of female poverty, the demographic groups most similar to Argentineans are Immigrants from Norway (12.8%, a difference of 0.050%), Immigrants from Ukraine (12.8%, a difference of 0.070%), South African (12.8%, a difference of 0.18%), Immigrants from Belarus (12.8%, a difference of 0.22%), and Immigrants from South Eastern Asia (12.7%, a difference of 0.23%).
| Demographics | Rating | Rank | Female Poverty |
| Sri Lankans | 90.9 /100 | #118 | Exceptional 12.7% |
| Albanians | 90.8 /100 | #119 | Exceptional 12.7% |
| New Zealanders | 90.6 /100 | #120 | Exceptional 12.7% |
| Immigrants | Hungary | 90.3 /100 | #121 | Exceptional 12.7% |
| French Canadians | 90.2 /100 | #122 | Exceptional 12.7% |
| Immigrants | South Eastern Asia | 89.9 /100 | #123 | Excellent 12.7% |
| Immigrants | Norway | 89.3 /100 | #124 | Excellent 12.8% |
| Argentineans | 89.1 /100 | #125 | Excellent 12.8% |
| Immigrants | Ukraine | 88.8 /100 | #126 | Excellent 12.8% |
| South Africans | 88.4 /100 | #127 | Excellent 12.8% |
| Immigrants | Belarus | 88.2 /100 | #128 | Excellent 12.8% |
| Immigrants | Brazil | 87.9 /100 | #129 | Excellent 12.8% |
| Immigrants | Vietnam | 87.1 /100 | #130 | Excellent 12.8% |
| Immigrants | Argentina | 87.0 /100 | #131 | Excellent 12.8% |
| Immigrants | Jordan | 86.9 /100 | #132 | Excellent 12.8% |
Demographics Similar to Spaniards by Female Poverty
In terms of female poverty, the demographic groups most similar to Spaniards are Immigrants from Western Asia (13.9%, a difference of 0.27%), Hmong (13.9%, a difference of 0.32%), Immigrants from Kenya (13.9%, a difference of 0.33%), Spanish (13.9%, a difference of 0.37%), and Ugandan (14.0%, a difference of 0.56%).
| Demographics | Rating | Rank | Female Poverty |
| Arabs | 28.6 /100 | #197 | Fair 13.7% |
| Immigrants | Uganda | 28.5 /100 | #198 | Fair 13.7% |
| Immigrants | Lebanon | 25.6 /100 | #199 | Fair 13.8% |
| Spanish | 21.4 /100 | #200 | Fair 13.9% |
| Immigrants | Kenya | 21.1 /100 | #201 | Fair 13.9% |
| Hmong | 21.1 /100 | #202 | Fair 13.9% |
| Immigrants | Western Asia | 20.7 /100 | #203 | Fair 13.9% |
| Spaniards | 18.9 /100 | #204 | Poor 13.9% |
| Ugandans | 15.4 /100 | #205 | Poor 14.0% |
| Immigrants | Uruguay | 14.0 /100 | #206 | Poor 14.0% |
| Immigrants | Eastern Africa | 9.0 /100 | #207 | Tragic 14.2% |
| Immigrants | Azores | 7.9 /100 | #208 | Tragic 14.2% |
| Panamanians | 7.7 /100 | #209 | Tragic 14.2% |
| Malaysians | 7.4 /100 | #210 | Tragic 14.3% |
| Moroccans | 7.2 /100 | #211 | Tragic 14.3% |