Argentinean vs Immigrants from Peru Female Poverty
COMPARE
Argentinean
Immigrants from Peru
Female Poverty
Female Poverty Comparison
Argentineans
Immigrants from Peru
12.8%
FEMALE POVERTY
89.1/ 100
METRIC RATING
125th/ 347
METRIC RANK
13.0%
FEMALE POVERTY
79.1/ 100
METRIC RATING
146th/ 347
METRIC RANK
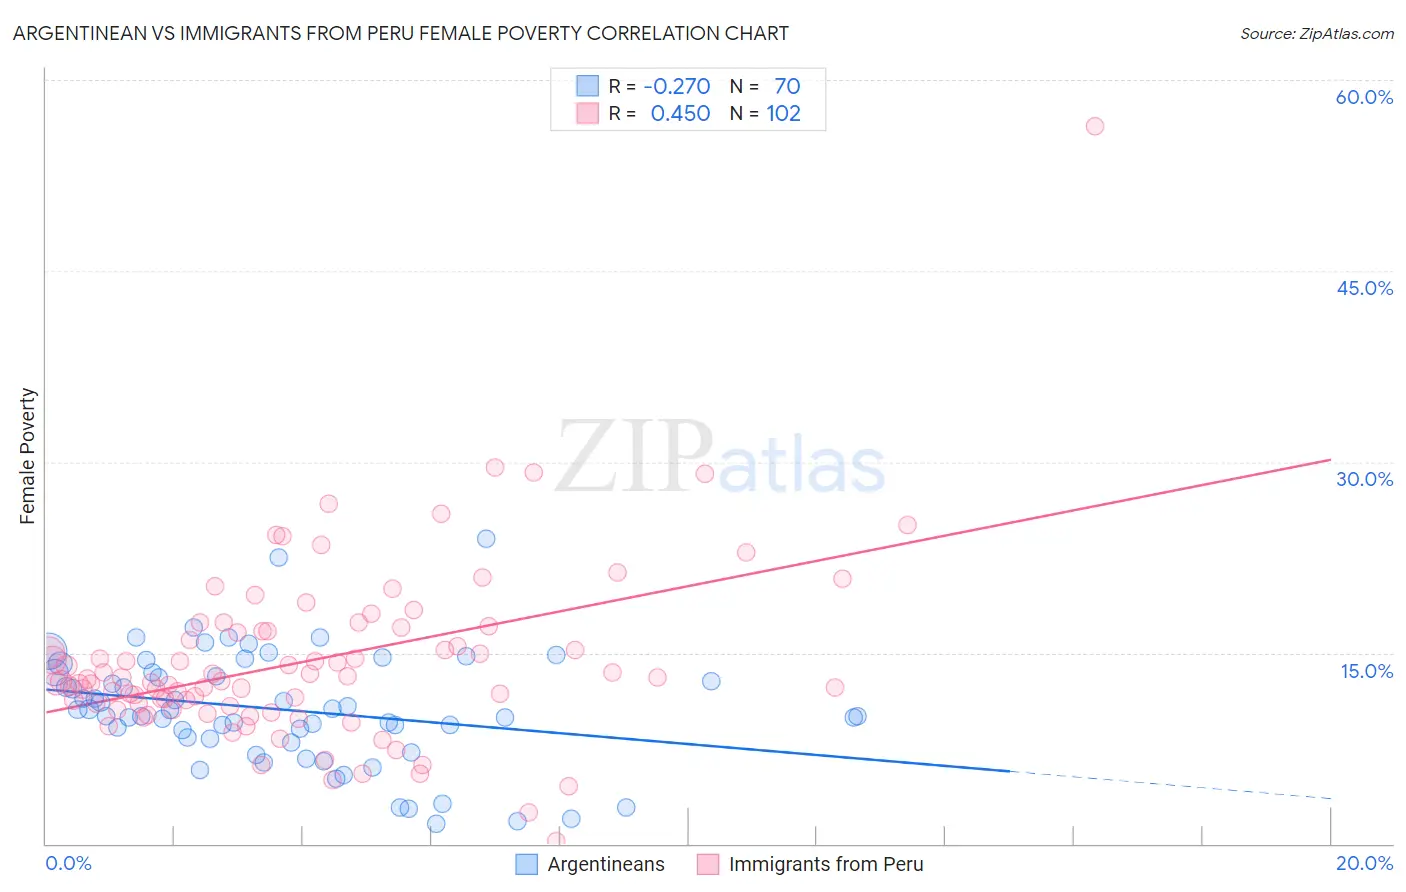
Argentinean vs Immigrants from Peru Female Poverty Correlation Chart
The statistical analysis conducted on geographies consisting of 296,942,880 people shows a weak negative correlation between the proportion of Argentineans and poverty level among females in the United States with a correlation coefficient (R) of -0.270 and weighted average of 12.8%. Similarly, the statistical analysis conducted on geographies consisting of 328,728,905 people shows a moderate positive correlation between the proportion of Immigrants from Peru and poverty level among females in the United States with a correlation coefficient (R) of 0.450 and weighted average of 13.0%, a difference of 1.9%.
Female Poverty Correlation Summary
| Measurement | Argentinean | Immigrants from Peru |
| Minimum | 1.6% | 0.21% |
| Maximum | 23.9% | 56.3% |
| Range | 22.4% | 56.1% |
| Mean | 10.5% | 14.4% |
| Median | 10.2% | 12.8% |
| Interquartile 25% (IQ1) | 8.3% | 11.0% |
| Interquartile 75% (IQ3) | 13.4% | 16.7% |
| Interquartile Range (IQR) | 5.2% | 5.7% |
| Standard Deviation (Sample) | 4.5% | 7.0% |
| Standard Deviation (Population) | 4.4% | 7.0% |
Similar Demographics by Female Poverty
Demographics Similar to Argentineans by Female Poverty
In terms of female poverty, the demographic groups most similar to Argentineans are Immigrants from Norway (12.8%, a difference of 0.050%), Immigrants from Ukraine (12.8%, a difference of 0.070%), South African (12.8%, a difference of 0.18%), Immigrants from Belarus (12.8%, a difference of 0.22%), and Immigrants from South Eastern Asia (12.7%, a difference of 0.23%).
| Demographics | Rating | Rank | Female Poverty |
| Sri Lankans | 90.9 /100 | #118 | Exceptional 12.7% |
| Albanians | 90.8 /100 | #119 | Exceptional 12.7% |
| New Zealanders | 90.6 /100 | #120 | Exceptional 12.7% |
| Immigrants | Hungary | 90.3 /100 | #121 | Exceptional 12.7% |
| French Canadians | 90.2 /100 | #122 | Exceptional 12.7% |
| Immigrants | South Eastern Asia | 89.9 /100 | #123 | Excellent 12.7% |
| Immigrants | Norway | 89.3 /100 | #124 | Excellent 12.8% |
| Argentineans | 89.1 /100 | #125 | Excellent 12.8% |
| Immigrants | Ukraine | 88.8 /100 | #126 | Excellent 12.8% |
| South Africans | 88.4 /100 | #127 | Excellent 12.8% |
| Immigrants | Belarus | 88.2 /100 | #128 | Excellent 12.8% |
| Immigrants | Brazil | 87.9 /100 | #129 | Excellent 12.8% |
| Immigrants | Vietnam | 87.1 /100 | #130 | Excellent 12.8% |
| Immigrants | Argentina | 87.0 /100 | #131 | Excellent 12.8% |
| Immigrants | Jordan | 86.9 /100 | #132 | Excellent 12.8% |
Demographics Similar to Immigrants from Peru by Female Poverty
In terms of female poverty, the demographic groups most similar to Immigrants from Peru are Syrian (13.0%, a difference of 0.080%), Immigrants from Kazakhstan (13.0%, a difference of 0.080%), Afghan (13.0%, a difference of 0.11%), Immigrants from Malaysia (13.0%, a difference of 0.19%), and Brazilian (13.0%, a difference of 0.22%).
| Demographics | Rating | Rank | Female Poverty |
| Basques | 83.1 /100 | #139 | Excellent 12.9% |
| Pakistanis | 83.0 /100 | #140 | Excellent 12.9% |
| Icelanders | 81.1 /100 | #141 | Excellent 13.0% |
| Brazilians | 80.5 /100 | #142 | Excellent 13.0% |
| Immigrants | Malaysia | 80.4 /100 | #143 | Excellent 13.0% |
| Afghans | 79.8 /100 | #144 | Good 13.0% |
| Syrians | 79.6 /100 | #145 | Good 13.0% |
| Immigrants | Peru | 79.1 /100 | #146 | Good 13.0% |
| Immigrants | Kazakhstan | 78.6 /100 | #147 | Good 13.0% |
| Yugoslavians | 76.9 /100 | #148 | Good 13.1% |
| Taiwanese | 75.7 /100 | #149 | Good 13.1% |
| Tsimshian | 75.5 /100 | #150 | Good 13.1% |
| Immigrants | Germany | 74.9 /100 | #151 | Good 13.1% |
| Samoans | 73.6 /100 | #152 | Good 13.1% |
| Immigrants | Fiji | 71.0 /100 | #153 | Good 13.2% |