Argentinean vs Immigrants from West Indies Female Poverty
COMPARE
Argentinean
Immigrants from West Indies
Female Poverty
Female Poverty Comparison
Argentineans
Immigrants from West Indies
12.8%
FEMALE POVERTY
89.1/ 100
METRIC RATING
125th/ 347
METRIC RANK
16.1%
FEMALE POVERTY
0.0/ 100
METRIC RATING
278th/ 347
METRIC RANK
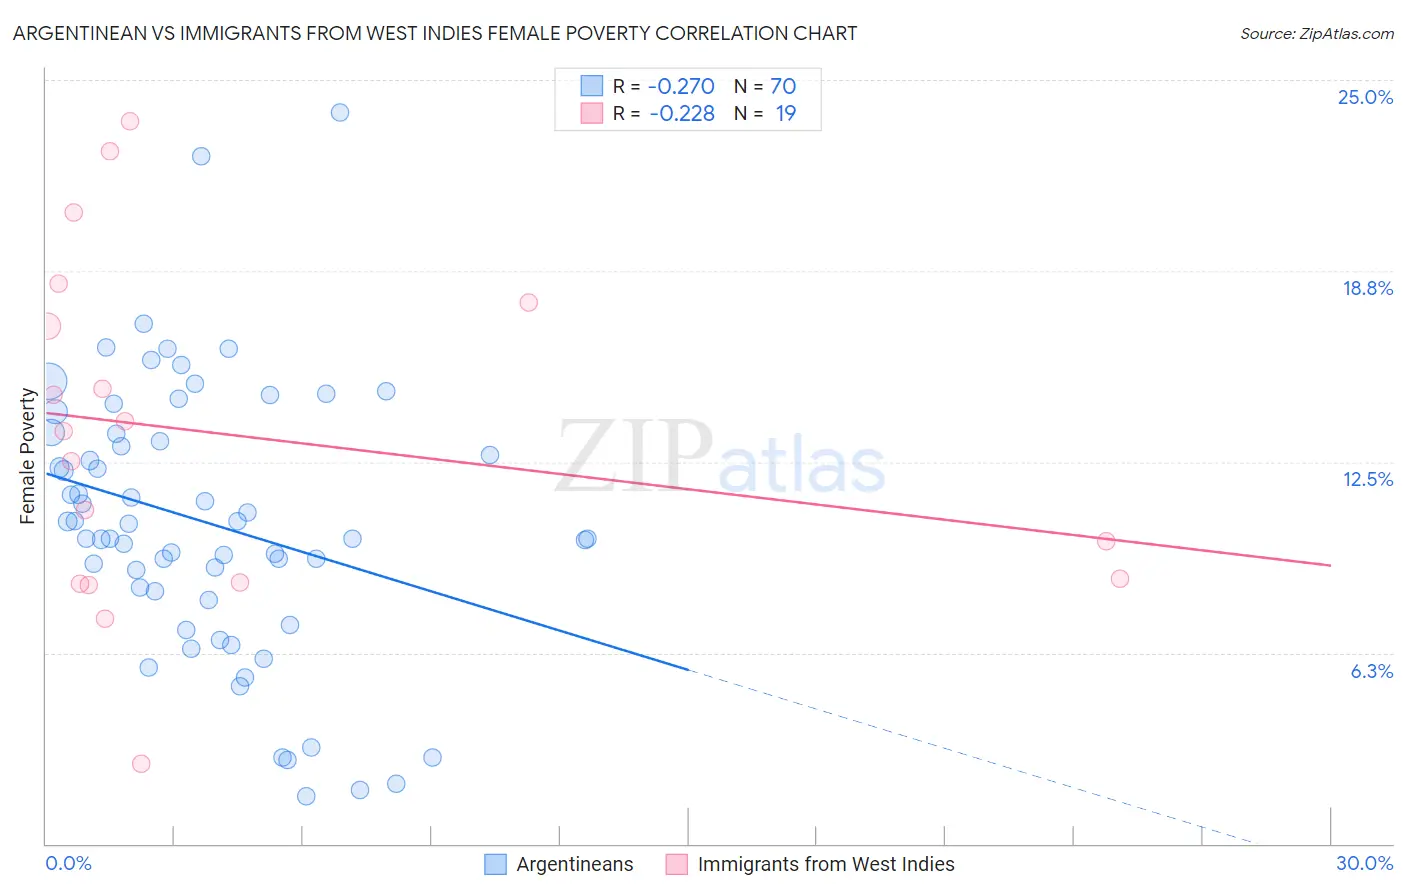
Argentinean vs Immigrants from West Indies Female Poverty Correlation Chart
The statistical analysis conducted on geographies consisting of 296,942,880 people shows a weak negative correlation between the proportion of Argentineans and poverty level among females in the United States with a correlation coefficient (R) of -0.270 and weighted average of 12.8%. Similarly, the statistical analysis conducted on geographies consisting of 72,454,628 people shows a weak negative correlation between the proportion of Immigrants from West Indies and poverty level among females in the United States with a correlation coefficient (R) of -0.228 and weighted average of 16.1%, a difference of 25.8%.
Female Poverty Correlation Summary
| Measurement | Argentinean | Immigrants from West Indies |
| Minimum | 1.6% | 2.6% |
| Maximum | 23.9% | 23.6% |
| Range | 22.4% | 21.0% |
| Mean | 10.5% | 13.4% |
| Median | 10.2% | 13.5% |
| Interquartile 25% (IQ1) | 8.3% | 8.5% |
| Interquartile 75% (IQ3) | 13.4% | 17.7% |
| Interquartile Range (IQR) | 5.2% | 9.2% |
| Standard Deviation (Sample) | 4.5% | 5.6% |
| Standard Deviation (Population) | 4.4% | 5.5% |
Similar Demographics by Female Poverty
Demographics Similar to Argentineans by Female Poverty
In terms of female poverty, the demographic groups most similar to Argentineans are Immigrants from Norway (12.8%, a difference of 0.050%), Immigrants from Ukraine (12.8%, a difference of 0.070%), South African (12.8%, a difference of 0.18%), Immigrants from Belarus (12.8%, a difference of 0.22%), and Immigrants from South Eastern Asia (12.7%, a difference of 0.23%).
| Demographics | Rating | Rank | Female Poverty |
| Sri Lankans | 90.9 /100 | #118 | Exceptional 12.7% |
| Albanians | 90.8 /100 | #119 | Exceptional 12.7% |
| New Zealanders | 90.6 /100 | #120 | Exceptional 12.7% |
| Immigrants | Hungary | 90.3 /100 | #121 | Exceptional 12.7% |
| French Canadians | 90.2 /100 | #122 | Exceptional 12.7% |
| Immigrants | South Eastern Asia | 89.9 /100 | #123 | Excellent 12.7% |
| Immigrants | Norway | 89.3 /100 | #124 | Excellent 12.8% |
| Argentineans | 89.1 /100 | #125 | Excellent 12.8% |
| Immigrants | Ukraine | 88.8 /100 | #126 | Excellent 12.8% |
| South Africans | 88.4 /100 | #127 | Excellent 12.8% |
| Immigrants | Belarus | 88.2 /100 | #128 | Excellent 12.8% |
| Immigrants | Brazil | 87.9 /100 | #129 | Excellent 12.8% |
| Immigrants | Vietnam | 87.1 /100 | #130 | Excellent 12.8% |
| Immigrants | Argentina | 87.0 /100 | #131 | Excellent 12.8% |
| Immigrants | Jordan | 86.9 /100 | #132 | Excellent 12.8% |
Demographics Similar to Immigrants from West Indies by Female Poverty
In terms of female poverty, the demographic groups most similar to Immigrants from West Indies are Immigrants from Bahamas (16.1%, a difference of 0.12%), Bangladeshi (16.0%, a difference of 0.31%), Vietnamese (16.1%, a difference of 0.35%), West Indian (16.1%, a difference of 0.37%), and Central American (16.0%, a difference of 0.50%).
| Demographics | Rating | Rank | Female Poverty |
| Immigrants | St. Vincent and the Grenadines | 0.0 /100 | #271 | Tragic 15.9% |
| Belizeans | 0.0 /100 | #272 | Tragic 15.9% |
| Haitians | 0.0 /100 | #273 | Tragic 15.9% |
| Barbadians | 0.0 /100 | #274 | Tragic 15.9% |
| Immigrants | Barbados | 0.0 /100 | #275 | Tragic 16.0% |
| Central Americans | 0.0 /100 | #276 | Tragic 16.0% |
| Bangladeshis | 0.0 /100 | #277 | Tragic 16.0% |
| Immigrants | West Indies | 0.0 /100 | #278 | Tragic 16.1% |
| Immigrants | Bahamas | 0.0 /100 | #279 | Tragic 16.1% |
| Vietnamese | 0.0 /100 | #280 | Tragic 16.1% |
| West Indians | 0.0 /100 | #281 | Tragic 16.1% |
| Immigrants | Haiti | 0.0 /100 | #282 | Tragic 16.1% |
| Immigrants | Cuba | 0.0 /100 | #283 | Tragic 16.1% |
| Spanish Americans | 0.0 /100 | #284 | Tragic 16.2% |
| Comanche | 0.0 /100 | #285 | Tragic 16.2% |