Potawatomi vs Chickasaw Female Poverty
COMPARE
Potawatomi
Chickasaw
Female Poverty
Female Poverty Comparison
Potawatomi
Chickasaw
15.3%
FEMALE POVERTY
0.3/ 100
METRIC RATING
247th/ 347
METRIC RANK
15.9%
FEMALE POVERTY
0.1/ 100
METRIC RATING
270th/ 347
METRIC RANK
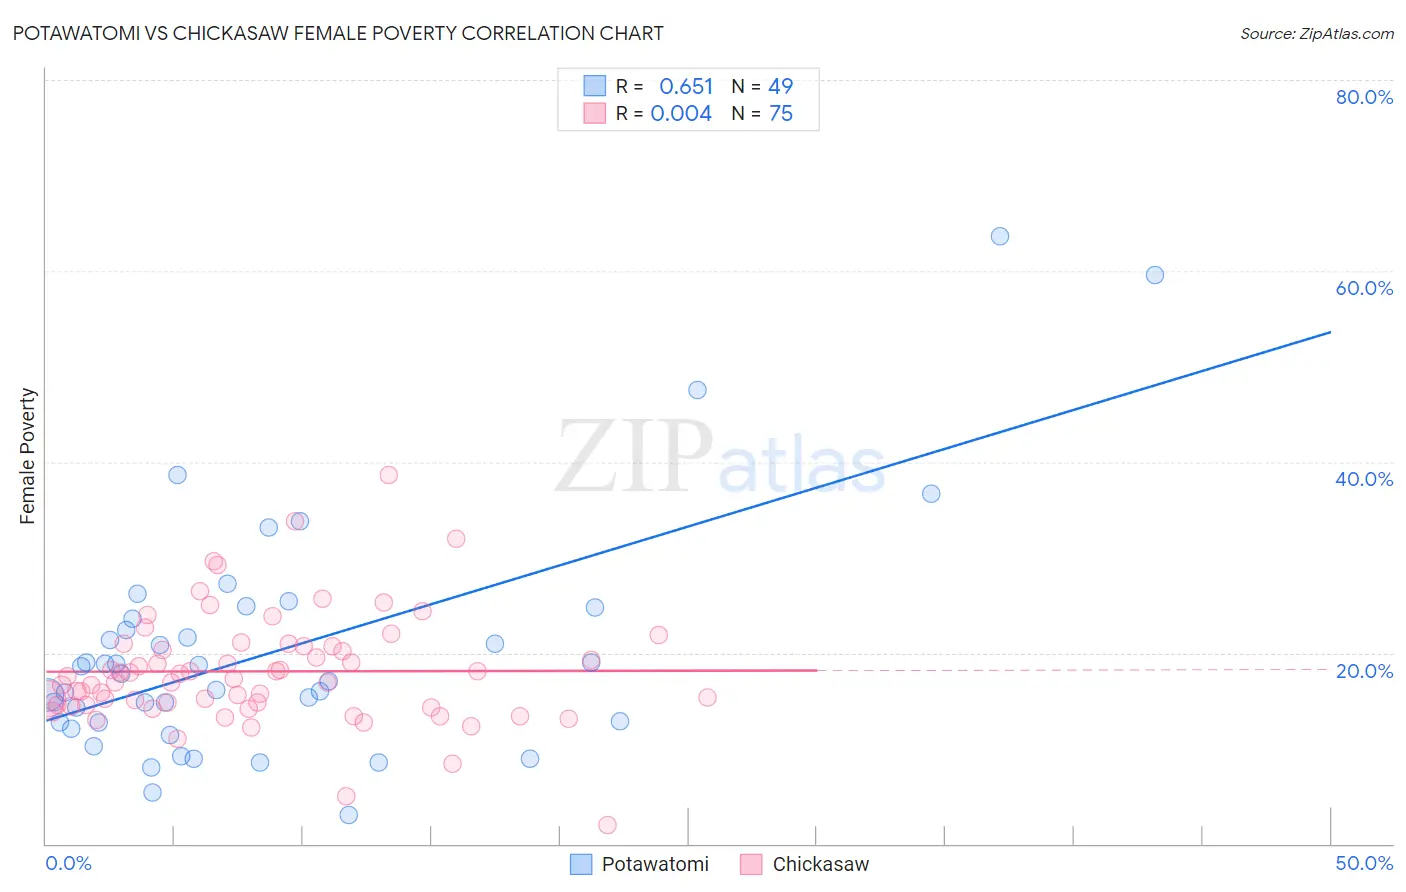
Potawatomi vs Chickasaw Female Poverty Correlation Chart
The statistical analysis conducted on geographies consisting of 117,742,920 people shows a significant positive correlation between the proportion of Potawatomi and poverty level among females in the United States with a correlation coefficient (R) of 0.651 and weighted average of 15.3%. Similarly, the statistical analysis conducted on geographies consisting of 147,658,289 people shows no correlation between the proportion of Chickasaw and poverty level among females in the United States with a correlation coefficient (R) of 0.004 and weighted average of 15.9%, a difference of 3.6%.
Female Poverty Correlation Summary
| Measurement | Potawatomi | Chickasaw |
| Minimum | 3.1% | 1.9% |
| Maximum | 63.6% | 38.6% |
| Range | 60.6% | 36.7% |
| Mean | 20.2% | 18.1% |
| Median | 17.8% | 17.3% |
| Interquartile 25% (IQ1) | 12.7% | 14.6% |
| Interquartile 75% (IQ3) | 24.2% | 20.7% |
| Interquartile Range (IQR) | 11.5% | 6.1% |
| Standard Deviation (Sample) | 12.3% | 5.9% |
| Standard Deviation (Population) | 12.2% | 5.9% |
Similar Demographics by Female Poverty
Demographics Similar to Potawatomi by Female Poverty
In terms of female poverty, the demographic groups most similar to Potawatomi are Immigrants from Ghana (15.3%, a difference of 0.0%), Cuban (15.3%, a difference of 0.010%), Spanish American Indian (15.3%, a difference of 0.060%), Salvadoran (15.3%, a difference of 0.14%), and Ecuadorian (15.3%, a difference of 0.16%).
| Demographics | Rating | Rank | Female Poverty |
| Sudanese | 0.5 /100 | #240 | Tragic 15.2% |
| Immigrants | Sudan | 0.4 /100 | #241 | Tragic 15.2% |
| Nepalese | 0.4 /100 | #242 | Tragic 15.2% |
| Nicaraguans | 0.3 /100 | #243 | Tragic 15.3% |
| Ecuadorians | 0.3 /100 | #244 | Tragic 15.3% |
| Spanish American Indians | 0.3 /100 | #245 | Tragic 15.3% |
| Cubans | 0.3 /100 | #246 | Tragic 15.3% |
| Potawatomi | 0.3 /100 | #247 | Tragic 15.3% |
| Immigrants | Ghana | 0.3 /100 | #248 | Tragic 15.3% |
| Salvadorans | 0.3 /100 | #249 | Tragic 15.3% |
| Immigrants | Western Africa | 0.3 /100 | #250 | Tragic 15.3% |
| Immigrants | Trinidad and Tobago | 0.3 /100 | #251 | Tragic 15.4% |
| Immigrants | Burma/Myanmar | 0.3 /100 | #252 | Tragic 15.4% |
| Liberians | 0.2 /100 | #253 | Tragic 15.4% |
| Trinidadians and Tobagonians | 0.2 /100 | #254 | Tragic 15.4% |
Demographics Similar to Chickasaw by Female Poverty
In terms of female poverty, the demographic groups most similar to Chickasaw are Iroquois (15.8%, a difference of 0.26%), Immigrants from St. Vincent and the Grenadines (15.9%, a difference of 0.28%), Belizean (15.9%, a difference of 0.50%), Haitian (15.9%, a difference of 0.51%), and Barbadian (15.9%, a difference of 0.51%).
| Demographics | Rating | Rank | Female Poverty |
| Cherokee | 0.1 /100 | #263 | Tragic 15.6% |
| Immigrants | Ecuador | 0.1 /100 | #264 | Tragic 15.6% |
| Immigrants | Liberia | 0.1 /100 | #265 | Tragic 15.7% |
| Immigrants | El Salvador | 0.1 /100 | #266 | Tragic 15.7% |
| Sub-Saharan Africans | 0.1 /100 | #267 | Tragic 15.8% |
| Immigrants | Nicaragua | 0.1 /100 | #268 | Tragic 15.8% |
| Iroquois | 0.1 /100 | #269 | Tragic 15.8% |
| Chickasaw | 0.1 /100 | #270 | Tragic 15.9% |
| Immigrants | St. Vincent and the Grenadines | 0.0 /100 | #271 | Tragic 15.9% |
| Belizeans | 0.0 /100 | #272 | Tragic 15.9% |
| Haitians | 0.0 /100 | #273 | Tragic 15.9% |
| Barbadians | 0.0 /100 | #274 | Tragic 15.9% |
| Immigrants | Barbados | 0.0 /100 | #275 | Tragic 16.0% |
| Central Americans | 0.0 /100 | #276 | Tragic 16.0% |
| Bangladeshis | 0.0 /100 | #277 | Tragic 16.0% |