Apache vs Cherokee Married-Couple Family Poverty
COMPARE
Apache
Cherokee
Married-Couple Family Poverty
Married-Couple Family Poverty Comparison
Apache
Cherokee
9.0%
MARRIED-COUPLE FAMILY POVERTY
0.0/ 100
METRIC RATING
336th/ 347
METRIC RANK
5.8%
MARRIED-COUPLE FAMILY POVERTY
2.7/ 100
METRIC RATING
238th/ 347
METRIC RANK
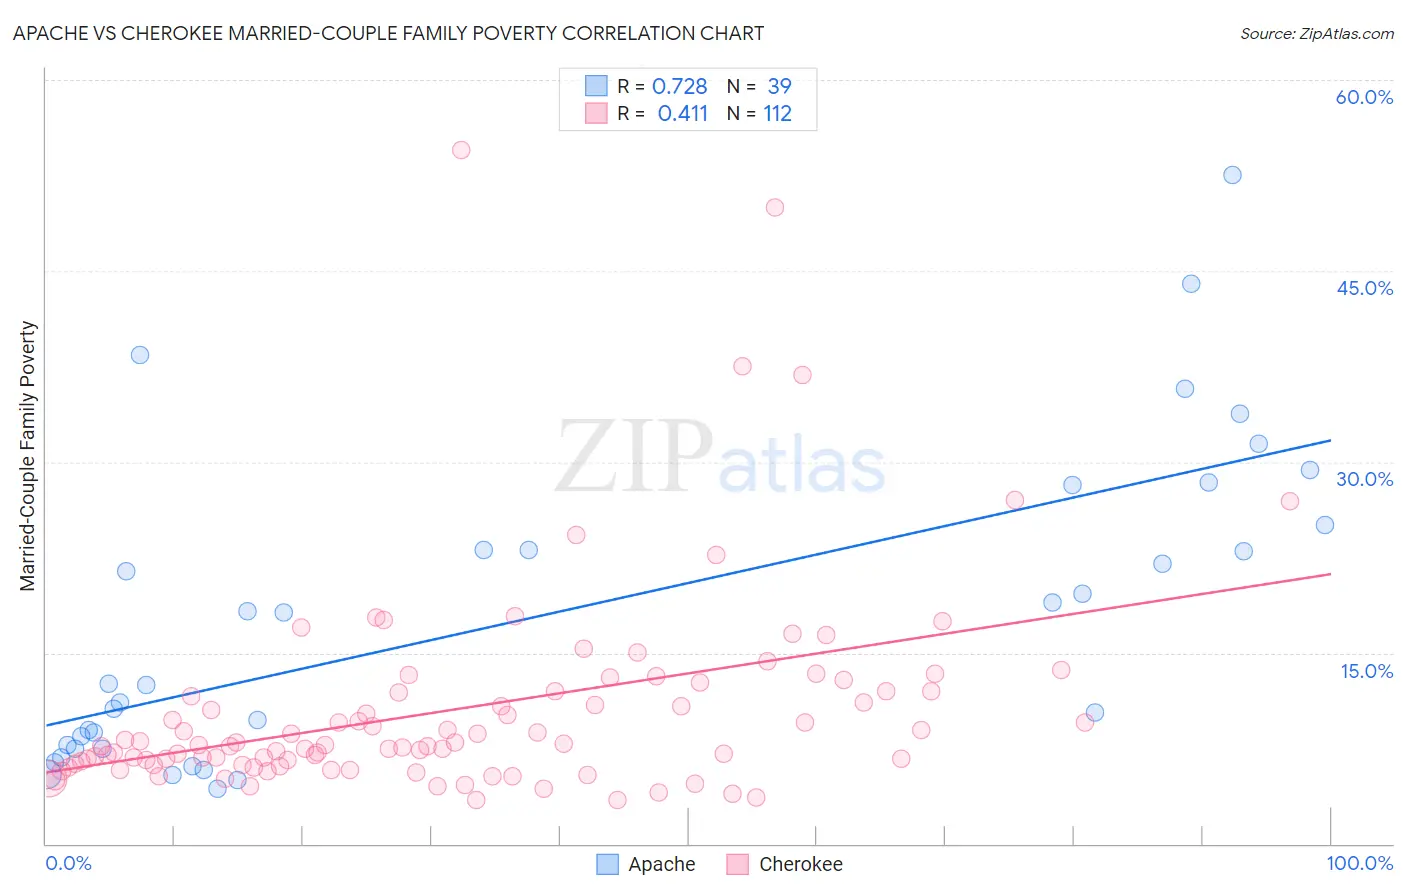
Apache vs Cherokee Married-Couple Family Poverty Correlation Chart
The statistical analysis conducted on geographies consisting of 230,238,952 people shows a strong positive correlation between the proportion of Apache and poverty level among married-couple families in the United States with a correlation coefficient (R) of 0.728 and weighted average of 9.0%. Similarly, the statistical analysis conducted on geographies consisting of 487,541,023 people shows a moderate positive correlation between the proportion of Cherokee and poverty level among married-couple families in the United States with a correlation coefficient (R) of 0.411 and weighted average of 5.8%, a difference of 55.4%.
Married-Couple Family Poverty Correlation Summary
| Measurement | Apache | Cherokee |
| Minimum | 4.3% | 3.4% |
| Maximum | 52.5% | 54.5% |
| Range | 48.2% | 51.1% |
| Mean | 17.8% | 10.6% |
| Median | 12.6% | 7.7% |
| Interquartile 25% (IQ1) | 7.5% | 6.2% |
| Interquartile 75% (IQ3) | 25.0% | 12.0% |
| Interquartile Range (IQR) | 17.5% | 5.8% |
| Standard Deviation (Sample) | 12.2% | 8.2% |
| Standard Deviation (Population) | 12.0% | 8.2% |
Similar Demographics by Married-Couple Family Poverty
Demographics Similar to Apache by Married-Couple Family Poverty
In terms of married-couple family poverty, the demographic groups most similar to Apache are Yakama (9.0%, a difference of 0.040%), Sioux (8.7%, a difference of 2.9%), Cheyenne (9.4%, a difference of 5.4%), Immigrants from Dominican Republic (8.4%, a difference of 6.6%), and Crow (9.6%, a difference of 6.8%).
| Demographics | Rating | Rank | Married-Couple Family Poverty |
| Natives/Alaskans | 0.0 /100 | #329 | Tragic 8.2% |
| Paiute | 0.0 /100 | #330 | Tragic 8.3% |
| Central American Indians | 0.0 /100 | #331 | Tragic 8.3% |
| Dominicans | 0.0 /100 | #332 | Tragic 8.3% |
| Lumbee | 0.0 /100 | #333 | Tragic 8.3% |
| Immigrants | Dominican Republic | 0.0 /100 | #334 | Tragic 8.4% |
| Sioux | 0.0 /100 | #335 | Tragic 8.7% |
| Apache | 0.0 /100 | #336 | Tragic 9.0% |
| Yakama | 0.0 /100 | #337 | Tragic 9.0% |
| Cheyenne | 0.0 /100 | #338 | Tragic 9.4% |
| Crow | 0.0 /100 | #339 | Tragic 9.6% |
| Yuman | 0.0 /100 | #340 | Tragic 9.7% |
| Pueblo | 0.0 /100 | #341 | Tragic 11.1% |
| Tohono O'odham | 0.0 /100 | #342 | Tragic 11.2% |
| Pima | 0.0 /100 | #343 | Tragic 11.4% |
Demographics Similar to Cherokee by Married-Couple Family Poverty
In terms of married-couple family poverty, the demographic groups most similar to Cherokee are Venezuelan (5.8%, a difference of 0.020%), Fijian (5.8%, a difference of 0.19%), Immigrants from Panama (5.8%, a difference of 0.22%), Immigrants from Western Africa (5.8%, a difference of 0.31%), and Immigrants from South America (5.7%, a difference of 0.38%).
| Demographics | Rating | Rank | Married-Couple Family Poverty |
| Immigrants | Iraq | 4.4 /100 | #231 | Tragic 5.7% |
| Immigrants | Laos | 4.4 /100 | #232 | Tragic 5.7% |
| Immigrants | Colombia | 3.7 /100 | #233 | Tragic 5.7% |
| Immigrants | Uruguay | 3.7 /100 | #234 | Tragic 5.7% |
| Immigrants | Sudan | 3.5 /100 | #235 | Tragic 5.7% |
| Ghanaians | 3.3 /100 | #236 | Tragic 5.7% |
| Immigrants | South America | 3.1 /100 | #237 | Tragic 5.7% |
| Cherokee | 2.7 /100 | #238 | Tragic 5.8% |
| Venezuelans | 2.7 /100 | #239 | Tragic 5.8% |
| Fijians | 2.5 /100 | #240 | Tragic 5.8% |
| Immigrants | Panama | 2.5 /100 | #241 | Tragic 5.8% |
| Immigrants | Western Africa | 2.4 /100 | #242 | Tragic 5.8% |
| Somalis | 2.3 /100 | #243 | Tragic 5.8% |
| Chickasaw | 2.3 /100 | #244 | Tragic 5.8% |
| Immigrants | Afghanistan | 2.1 /100 | #245 | Tragic 5.8% |