Apache vs Inupiat Married-Couple Family Poverty
COMPARE
Apache
Inupiat
Married-Couple Family Poverty
Married-Couple Family Poverty Comparison
Apache
Inupiat
9.0%
MARRIED-COUPLE FAMILY POVERTY
0.0/ 100
METRIC RATING
336th/ 347
METRIC RANK
7.1%
MARRIED-COUPLE FAMILY POVERTY
0.0/ 100
METRIC RATING
315th/ 347
METRIC RANK
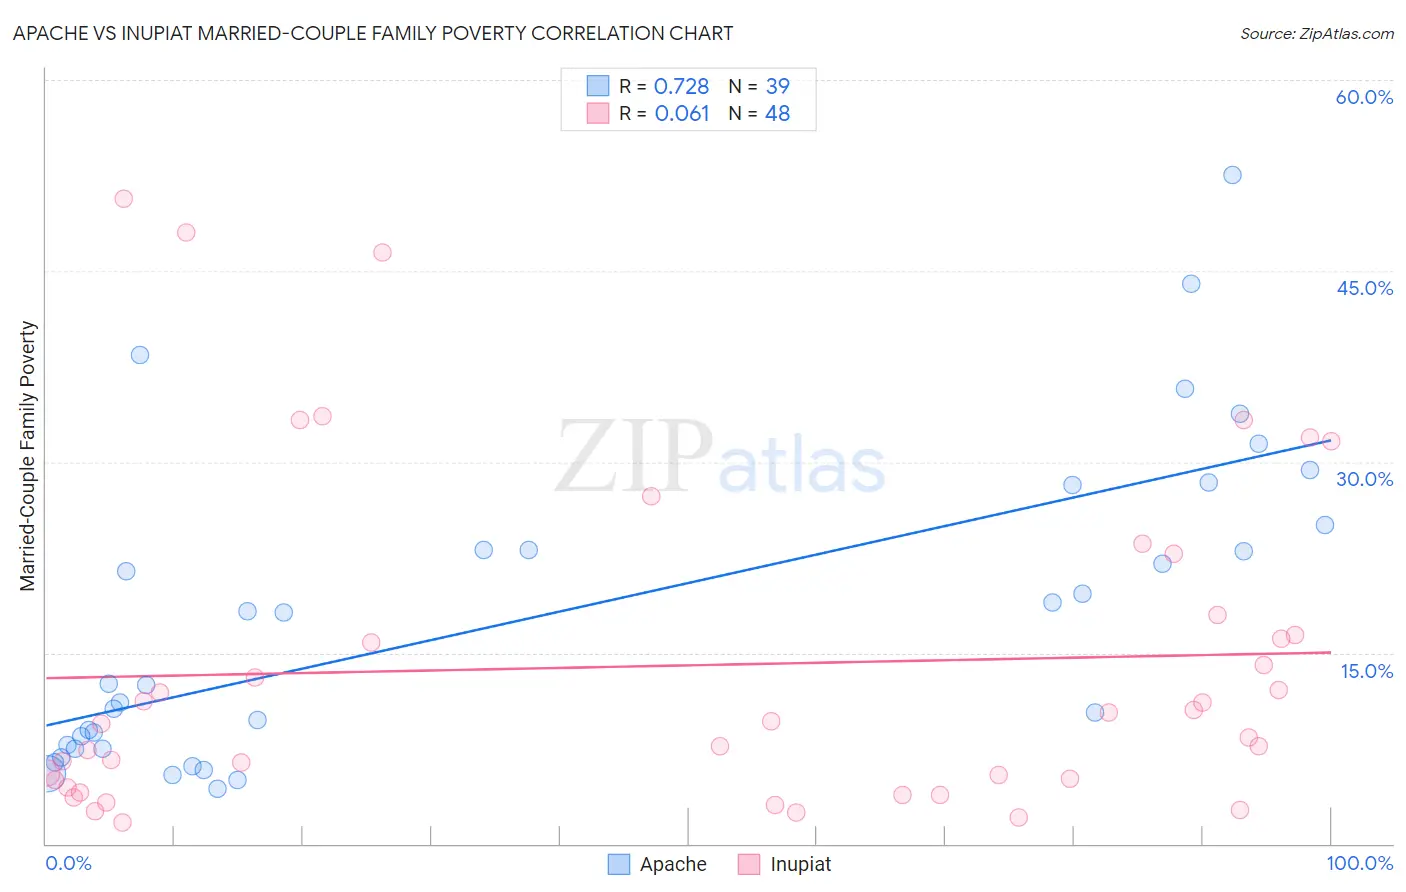
Apache vs Inupiat Married-Couple Family Poverty Correlation Chart
The statistical analysis conducted on geographies consisting of 230,238,952 people shows a strong positive correlation between the proportion of Apache and poverty level among married-couple families in the United States with a correlation coefficient (R) of 0.728 and weighted average of 9.0%. Similarly, the statistical analysis conducted on geographies consisting of 96,004,773 people shows a slight positive correlation between the proportion of Inupiat and poverty level among married-couple families in the United States with a correlation coefficient (R) of 0.061 and weighted average of 7.1%, a difference of 25.3%.
Married-Couple Family Poverty Correlation Summary
| Measurement | Apache | Inupiat |
| Minimum | 4.3% | 1.6% |
| Maximum | 52.5% | 50.7% |
| Range | 48.2% | 49.0% |
| Mean | 17.8% | 14.0% |
| Median | 12.6% | 9.6% |
| Interquartile 25% (IQ1) | 7.5% | 4.7% |
| Interquartile 75% (IQ3) | 25.0% | 17.2% |
| Interquartile Range (IQR) | 17.5% | 12.5% |
| Standard Deviation (Sample) | 12.2% | 12.9% |
| Standard Deviation (Population) | 12.0% | 12.8% |
Similar Demographics by Married-Couple Family Poverty
Demographics Similar to Apache by Married-Couple Family Poverty
In terms of married-couple family poverty, the demographic groups most similar to Apache are Yakama (9.0%, a difference of 0.040%), Sioux (8.7%, a difference of 2.9%), Cheyenne (9.4%, a difference of 5.4%), Immigrants from Dominican Republic (8.4%, a difference of 6.6%), and Crow (9.6%, a difference of 6.8%).
| Demographics | Rating | Rank | Married-Couple Family Poverty |
| Natives/Alaskans | 0.0 /100 | #329 | Tragic 8.2% |
| Paiute | 0.0 /100 | #330 | Tragic 8.3% |
| Central American Indians | 0.0 /100 | #331 | Tragic 8.3% |
| Dominicans | 0.0 /100 | #332 | Tragic 8.3% |
| Lumbee | 0.0 /100 | #333 | Tragic 8.3% |
| Immigrants | Dominican Republic | 0.0 /100 | #334 | Tragic 8.4% |
| Sioux | 0.0 /100 | #335 | Tragic 8.7% |
| Apache | 0.0 /100 | #336 | Tragic 9.0% |
| Yakama | 0.0 /100 | #337 | Tragic 9.0% |
| Cheyenne | 0.0 /100 | #338 | Tragic 9.4% |
| Crow | 0.0 /100 | #339 | Tragic 9.6% |
| Yuman | 0.0 /100 | #340 | Tragic 9.7% |
| Pueblo | 0.0 /100 | #341 | Tragic 11.1% |
| Tohono O'odham | 0.0 /100 | #342 | Tragic 11.2% |
| Pima | 0.0 /100 | #343 | Tragic 11.4% |
Demographics Similar to Inupiat by Married-Couple Family Poverty
In terms of married-couple family poverty, the demographic groups most similar to Inupiat are Honduran (7.2%, a difference of 0.15%), British West Indian (7.1%, a difference of 0.24%), Mexican (7.2%, a difference of 0.47%), Immigrants from St. Vincent and the Grenadines (7.1%, a difference of 0.54%), and Immigrants from Guatemala (7.2%, a difference of 0.63%).
| Demographics | Rating | Rank | Married-Couple Family Poverty |
| Spanish American Indians | 0.0 /100 | #308 | Tragic 7.1% |
| Hopi | 0.0 /100 | #309 | Tragic 7.1% |
| Immigrants | Nicaragua | 0.0 /100 | #310 | Tragic 7.1% |
| Immigrants | Dominica | 0.0 /100 | #311 | Tragic 7.1% |
| Immigrants | Armenia | 0.0 /100 | #312 | Tragic 7.1% |
| Immigrants | St. Vincent and the Grenadines | 0.0 /100 | #313 | Tragic 7.1% |
| British West Indians | 0.0 /100 | #314 | Tragic 7.1% |
| Inupiat | 0.0 /100 | #315 | Tragic 7.1% |
| Hondurans | 0.0 /100 | #316 | Tragic 7.2% |
| Mexicans | 0.0 /100 | #317 | Tragic 7.2% |
| Immigrants | Guatemala | 0.0 /100 | #318 | Tragic 7.2% |
| Immigrants | Latin America | 0.0 /100 | #319 | Tragic 7.2% |
| Immigrants | Grenada | 0.0 /100 | #320 | Tragic 7.3% |
| Immigrants | Caribbean | 0.0 /100 | #321 | Tragic 7.3% |
| Immigrants | Honduras | 0.0 /100 | #322 | Tragic 7.3% |