Apache vs Tlingit-Haida Married-Couple Family Poverty
COMPARE
Apache
Tlingit-Haida
Married-Couple Family Poverty
Married-Couple Family Poverty Comparison
Apache
Tlingit-Haida
9.0%
MARRIED-COUPLE FAMILY POVERTY
0.0/ 100
METRIC RATING
336th/ 347
METRIC RANK
4.4%
MARRIED-COUPLE FAMILY POVERTY
99.6/ 100
METRIC RATING
60th/ 347
METRIC RANK
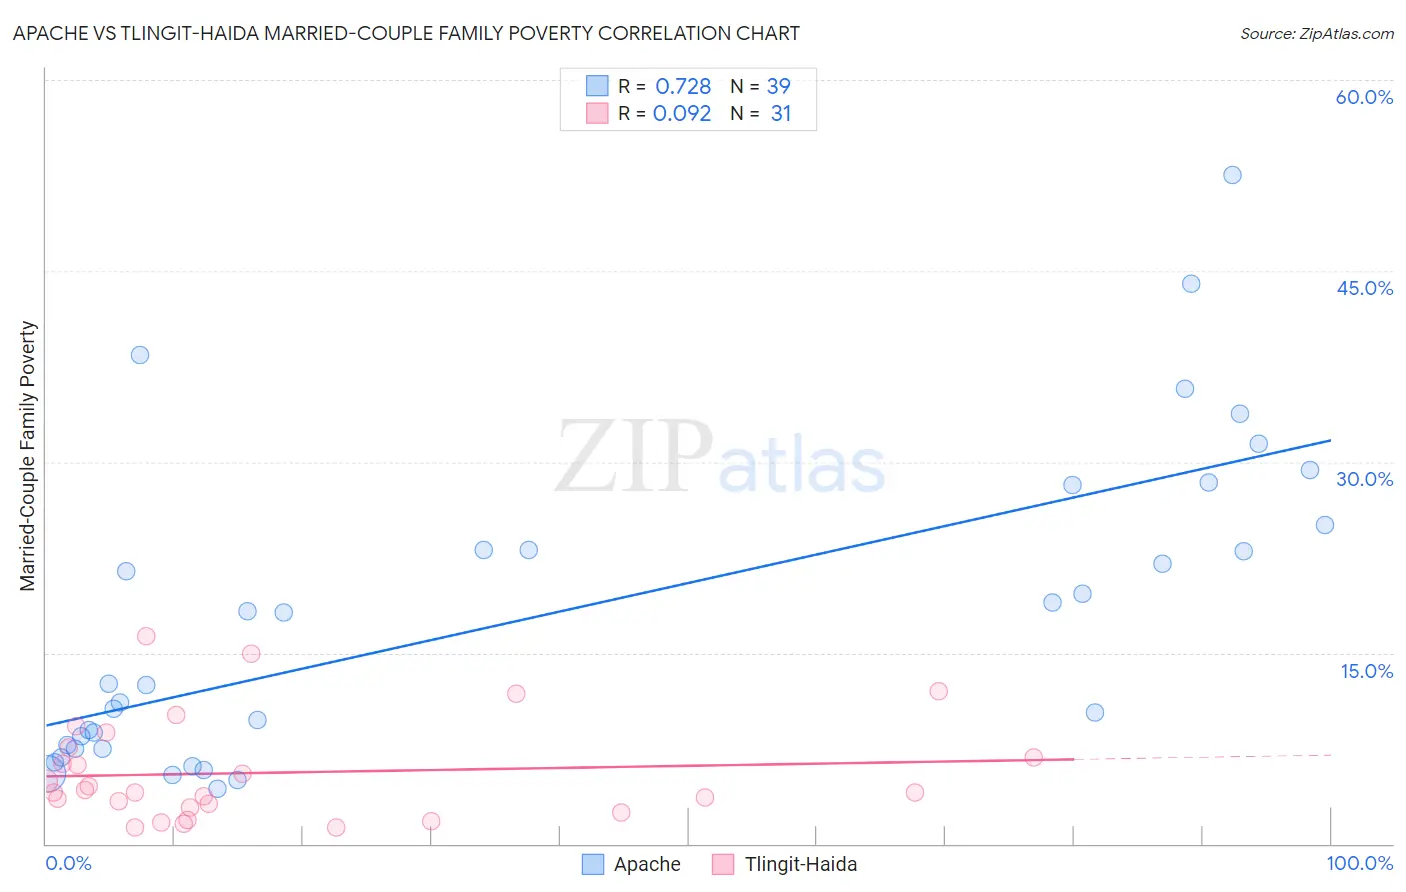
Apache vs Tlingit-Haida Married-Couple Family Poverty Correlation Chart
The statistical analysis conducted on geographies consisting of 230,238,952 people shows a strong positive correlation between the proportion of Apache and poverty level among married-couple families in the United States with a correlation coefficient (R) of 0.728 and weighted average of 9.0%. Similarly, the statistical analysis conducted on geographies consisting of 60,624,230 people shows a slight positive correlation between the proportion of Tlingit-Haida and poverty level among married-couple families in the United States with a correlation coefficient (R) of 0.092 and weighted average of 4.4%, a difference of 104.6%.
Married-Couple Family Poverty Correlation Summary
| Measurement | Apache | Tlingit-Haida |
| Minimum | 4.3% | 1.3% |
| Maximum | 52.5% | 16.3% |
| Range | 48.2% | 15.1% |
| Mean | 17.8% | 5.6% |
| Median | 12.6% | 4.1% |
| Interquartile 25% (IQ1) | 7.5% | 2.8% |
| Interquartile 75% (IQ3) | 25.0% | 7.5% |
| Interquartile Range (IQR) | 17.5% | 4.7% |
| Standard Deviation (Sample) | 12.2% | 4.0% |
| Standard Deviation (Population) | 12.0% | 3.9% |
Similar Demographics by Married-Couple Family Poverty
Demographics Similar to Apache by Married-Couple Family Poverty
In terms of married-couple family poverty, the demographic groups most similar to Apache are Yakama (9.0%, a difference of 0.040%), Sioux (8.7%, a difference of 2.9%), Cheyenne (9.4%, a difference of 5.4%), Immigrants from Dominican Republic (8.4%, a difference of 6.6%), and Crow (9.6%, a difference of 6.8%).
| Demographics | Rating | Rank | Married-Couple Family Poverty |
| Natives/Alaskans | 0.0 /100 | #329 | Tragic 8.2% |
| Paiute | 0.0 /100 | #330 | Tragic 8.3% |
| Central American Indians | 0.0 /100 | #331 | Tragic 8.3% |
| Dominicans | 0.0 /100 | #332 | Tragic 8.3% |
| Lumbee | 0.0 /100 | #333 | Tragic 8.3% |
| Immigrants | Dominican Republic | 0.0 /100 | #334 | Tragic 8.4% |
| Sioux | 0.0 /100 | #335 | Tragic 8.7% |
| Apache | 0.0 /100 | #336 | Tragic 9.0% |
| Yakama | 0.0 /100 | #337 | Tragic 9.0% |
| Cheyenne | 0.0 /100 | #338 | Tragic 9.4% |
| Crow | 0.0 /100 | #339 | Tragic 9.6% |
| Yuman | 0.0 /100 | #340 | Tragic 9.7% |
| Pueblo | 0.0 /100 | #341 | Tragic 11.1% |
| Tohono O'odham | 0.0 /100 | #342 | Tragic 11.2% |
| Pima | 0.0 /100 | #343 | Tragic 11.4% |
Demographics Similar to Tlingit-Haida by Married-Couple Family Poverty
In terms of married-couple family poverty, the demographic groups most similar to Tlingit-Haida are Immigrants from Sweden (4.4%, a difference of 0.070%), Okinawan (4.4%, a difference of 0.11%), Immigrants from Australia (4.4%, a difference of 0.12%), Immigrants from Sri Lanka (4.4%, a difference of 0.49%), and Czechoslovakian (4.4%, a difference of 0.62%).
| Demographics | Rating | Rank | Married-Couple Family Poverty |
| Welsh | 99.7 /100 | #53 | Exceptional 4.3% |
| Austrians | 99.7 /100 | #54 | Exceptional 4.3% |
| French | 99.7 /100 | #55 | Exceptional 4.3% |
| Immigrants | Zimbabwe | 99.7 /100 | #56 | Exceptional 4.3% |
| Immigrants | Netherlands | 99.7 /100 | #57 | Exceptional 4.3% |
| Czechoslovakians | 99.7 /100 | #58 | Exceptional 4.4% |
| Immigrants | Sweden | 99.6 /100 | #59 | Exceptional 4.4% |
| Tlingit-Haida | 99.6 /100 | #60 | Exceptional 4.4% |
| Okinawans | 99.6 /100 | #61 | Exceptional 4.4% |
| Immigrants | Australia | 99.6 /100 | #62 | Exceptional 4.4% |
| Immigrants | Sri Lanka | 99.6 /100 | #63 | Exceptional 4.4% |
| Immigrants | Bulgaria | 99.5 /100 | #64 | Exceptional 4.4% |
| Macedonians | 99.4 /100 | #65 | Exceptional 4.4% |
| Immigrants | Serbia | 99.4 /100 | #66 | Exceptional 4.4% |
| Immigrants | Canada | 99.4 /100 | #67 | Exceptional 4.4% |