Ugandan vs Cherokee Married-Couple Family Poverty
COMPARE
Ugandan
Cherokee
Married-Couple Family Poverty
Married-Couple Family Poverty Comparison
Ugandans
Cherokee
5.3%
MARRIED-COUPLE FAMILY POVERTY
31.6/ 100
METRIC RATING
190th/ 347
METRIC RANK
5.8%
MARRIED-COUPLE FAMILY POVERTY
2.7/ 100
METRIC RATING
238th/ 347
METRIC RANK
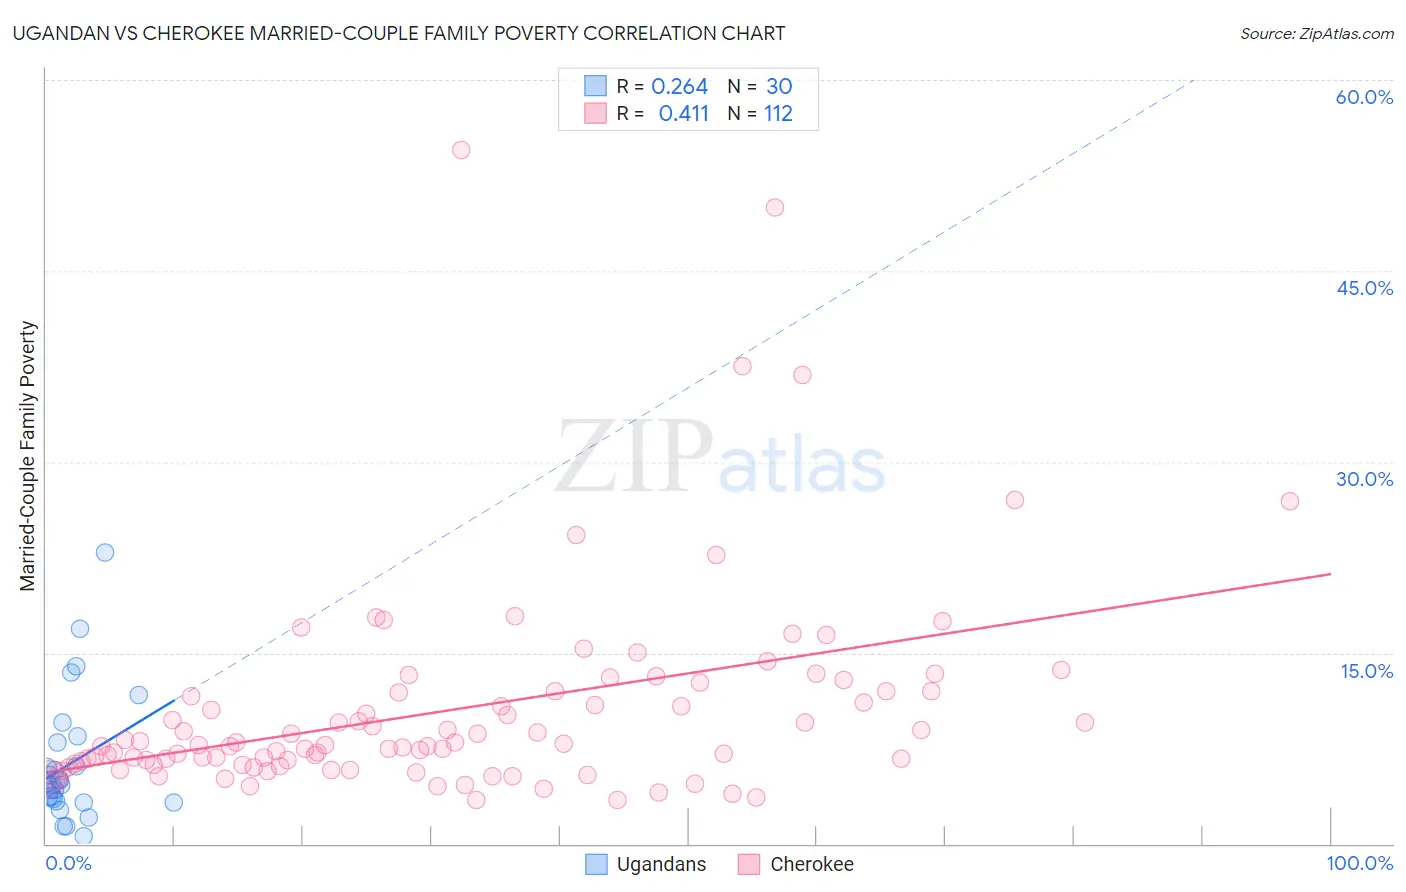
Ugandan vs Cherokee Married-Couple Family Poverty Correlation Chart
The statistical analysis conducted on geographies consisting of 93,779,769 people shows a weak positive correlation between the proportion of Ugandans and poverty level among married-couple families in the United States with a correlation coefficient (R) of 0.264 and weighted average of 5.3%. Similarly, the statistical analysis conducted on geographies consisting of 487,541,023 people shows a moderate positive correlation between the proportion of Cherokee and poverty level among married-couple families in the United States with a correlation coefficient (R) of 0.411 and weighted average of 5.8%, a difference of 8.0%.
Married-Couple Family Poverty Correlation Summary
| Measurement | Ugandan | Cherokee |
| Minimum | 0.62% | 3.4% |
| Maximum | 22.9% | 54.5% |
| Range | 22.2% | 51.1% |
| Mean | 6.3% | 10.6% |
| Median | 4.7% | 7.7% |
| Interquartile 25% (IQ1) | 3.4% | 6.2% |
| Interquartile 75% (IQ3) | 7.9% | 12.0% |
| Interquartile Range (IQR) | 4.5% | 5.8% |
| Standard Deviation (Sample) | 5.0% | 8.2% |
| Standard Deviation (Population) | 4.9% | 8.2% |
Similar Demographics by Married-Couple Family Poverty
Demographics Similar to Ugandans by Married-Couple Family Poverty
In terms of married-couple family poverty, the demographic groups most similar to Ugandans are Immigrants from Cabo Verde (5.3%, a difference of 0.090%), South American Indian (5.3%, a difference of 0.11%), Cape Verdean (5.3%, a difference of 0.12%), Israeli (5.3%, a difference of 0.20%), and Immigrants from Albania (5.3%, a difference of 0.29%).
| Demographics | Rating | Rank | Married-Couple Family Poverty |
| Peruvians | 37.6 /100 | #183 | Fair 5.3% |
| Immigrants | Nonimmigrants | 35.8 /100 | #184 | Fair 5.3% |
| Americans | 35.4 /100 | #185 | Fair 5.3% |
| Hungarians | 34.7 /100 | #186 | Fair 5.3% |
| Immigrants | Albania | 33.8 /100 | #187 | Fair 5.3% |
| Israelis | 33.1 /100 | #188 | Fair 5.3% |
| South American Indians | 32.5 /100 | #189 | Fair 5.3% |
| Ugandans | 31.6 /100 | #190 | Fair 5.3% |
| Immigrants | Cabo Verde | 30.9 /100 | #191 | Fair 5.3% |
| Cape Verdeans | 30.7 /100 | #192 | Fair 5.3% |
| Malaysians | 29.5 /100 | #193 | Fair 5.4% |
| Immigrants | Israel | 27.8 /100 | #194 | Fair 5.4% |
| Immigrants | Azores | 27.5 /100 | #195 | Fair 5.4% |
| Spaniards | 27.4 /100 | #196 | Fair 5.4% |
| Liberians | 26.3 /100 | #197 | Fair 5.4% |
Demographics Similar to Cherokee by Married-Couple Family Poverty
In terms of married-couple family poverty, the demographic groups most similar to Cherokee are Venezuelan (5.8%, a difference of 0.020%), Fijian (5.8%, a difference of 0.19%), Immigrants from Panama (5.8%, a difference of 0.22%), Immigrants from Western Africa (5.8%, a difference of 0.31%), and Immigrants from South America (5.7%, a difference of 0.38%).
| Demographics | Rating | Rank | Married-Couple Family Poverty |
| Immigrants | Iraq | 4.4 /100 | #231 | Tragic 5.7% |
| Immigrants | Laos | 4.4 /100 | #232 | Tragic 5.7% |
| Immigrants | Colombia | 3.7 /100 | #233 | Tragic 5.7% |
| Immigrants | Uruguay | 3.7 /100 | #234 | Tragic 5.7% |
| Immigrants | Sudan | 3.5 /100 | #235 | Tragic 5.7% |
| Ghanaians | 3.3 /100 | #236 | Tragic 5.7% |
| Immigrants | South America | 3.1 /100 | #237 | Tragic 5.7% |
| Cherokee | 2.7 /100 | #238 | Tragic 5.8% |
| Venezuelans | 2.7 /100 | #239 | Tragic 5.8% |
| Fijians | 2.5 /100 | #240 | Tragic 5.8% |
| Immigrants | Panama | 2.5 /100 | #241 | Tragic 5.8% |
| Immigrants | Western Africa | 2.4 /100 | #242 | Tragic 5.8% |
| Somalis | 2.3 /100 | #243 | Tragic 5.8% |
| Chickasaw | 2.3 /100 | #244 | Tragic 5.8% |
| Immigrants | Afghanistan | 2.1 /100 | #245 | Tragic 5.8% |