Zip Codes with the Highest Percentage of Population Employed in Legal Services & Support in Allentown, PA
RELATED REPORTS & OPTIONS
Legal Services & Support
Allentown
Compare Zip Codes
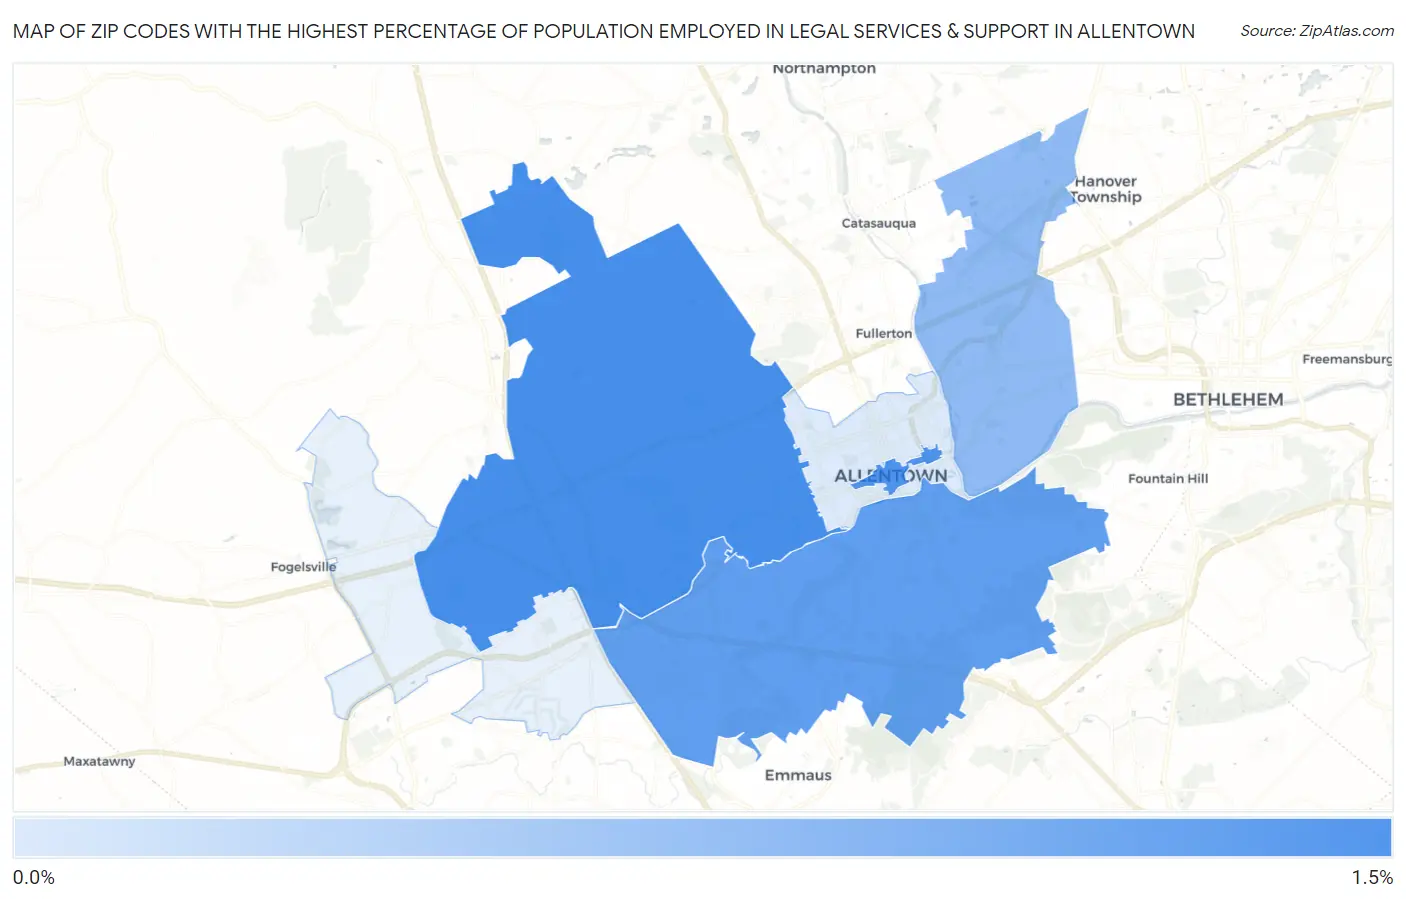
Map of Zip Codes with the Highest Percentage of Population Employed in Legal Services & Support in Allentown
0.14%
1.2%
Zip Codes with the Highest Percentage of Population Employed in Legal Services & Support in Allentown, PA
| Zip Code | % Employed | vs State | vs National | |
| 1. | 18104 | 1.2% | 1.1%(+0.012)#306 | 1.2%(-0.025)#6,768 |
| 2. | 18101 | 1.1% | 1.1%(-0.049)#327 | 1.2%(-0.085)#7,180 |
| 3. | 18103 | 0.98% | 1.1%(-0.166)#373 | 1.2%(-0.202)#7,945 |
| 4. | 18109 | 0.67% | 1.1%(-0.475)#513 | 1.2%(-0.512)#10,706 |
| 5. | 18102 | 0.14% | 1.1%(-1.01)#858 | 1.2%(-1.05)#16,812 |
1
Common Questions
What are the Top 5 Zip Codes with the Highest Percentage of Population Employed in Legal Services & Support in Allentown, PA?
Top 5 Zip Codes with the Highest Percentage of Population Employed in Legal Services & Support in Allentown, PA are:
What zip code has the Highest Percentage of Population Employed in Legal Services & Support in Allentown, PA?
18104 has the Highest Percentage of Population Employed in Legal Services & Support in Allentown, PA with 1.2%.
What is the Percentage of Population Employed in Legal Services & Support in Allentown, PA?
Percentage of Population Employed in Legal Services & Support in Allentown is 0.65%.
What is the Percentage of Population Employed in Legal Services & Support in Pennsylvania?
Percentage of Population Employed in Legal Services & Support in Pennsylvania is 1.1%.
What is the Percentage of Population Employed in Legal Services & Support in the United States?
Percentage of Population Employed in Legal Services & Support in the United States is 1.2%.