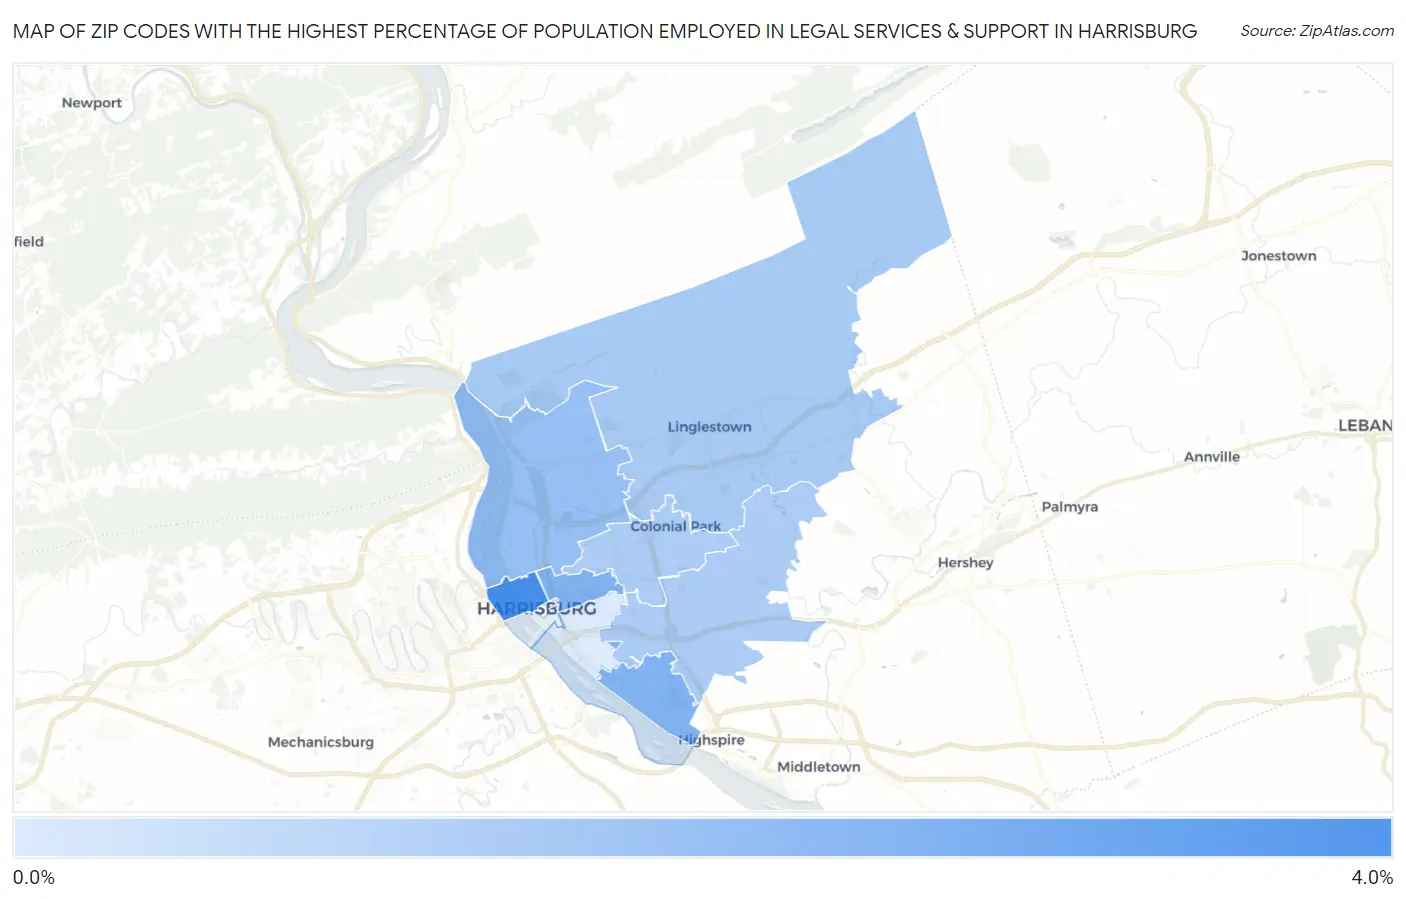
Zip Codes with the Highest Percentage of Population Employed in Legal Services & Support in Harrisburg, PA
RELATED REPORTS & OPTIONS
Legal Services & Support
Harrisburg
Compare Zip Codes
Map of Zip Codes with the Highest Percentage of Population Employed in Legal Services & Support in Harrisburg
0.19%
3.3%

Zip Codes with the Highest Percentage of Population Employed in Legal Services & Support in Harrisburg, PA
| Zip Code | % Employed | vs State | vs National | |
| 1. | 17102 | 3.3% | 1.1%(+2.12)#77 | 1.2%(+2.08)#1,599 |
| 2. | 17113 | 2.1% | 1.1%(+0.926)#151 | 1.2%(+0.889)#3,285 |
| 3. | 17103 | 2.1% | 1.1%(+0.919)#153 | 1.2%(+0.883)#3,296 |
| 4. | 17110 | 1.6% | 1.1%(+0.456)#209 | 1.2%(+0.419)#4,664 |
| 5. | 17112 | 1.2% | 1.1%(+0.099)#279 | 1.2%(+0.062)#6,232 |
| 6. | 17111 | 1.2% | 1.1%(+0.035)#294 | 1.2%(-0.001)#6,623 |
| 7. | 17109 | 1.2% | 1.1%(+0.013)#305 | 1.2%(-0.023)#6,764 |
| 8. | 17104 | 0.19% | 1.1%(-0.959)#829 | 1.2%(-0.995)#16,317 |
1
Common Questions
What are the Top 5 Zip Codes with the Highest Percentage of Population Employed in Legal Services & Support in Harrisburg, PA?
Top 5 Zip Codes with the Highest Percentage of Population Employed in Legal Services & Support in Harrisburg, PA are:
What zip code has the Highest Percentage of Population Employed in Legal Services & Support in Harrisburg, PA?
17102 has the Highest Percentage of Population Employed in Legal Services & Support in Harrisburg, PA with 3.3%.
What is the Percentage of Population Employed in Legal Services & Support in Harrisburg, PA?
Percentage of Population Employed in Legal Services & Support in Harrisburg is 1.4%.
What is the Percentage of Population Employed in Legal Services & Support in Pennsylvania?
Percentage of Population Employed in Legal Services & Support in Pennsylvania is 1.1%.
What is the Percentage of Population Employed in Legal Services & Support in the United States?
Percentage of Population Employed in Legal Services & Support in the United States is 1.2%.