Coos County, NH Map & Demographics
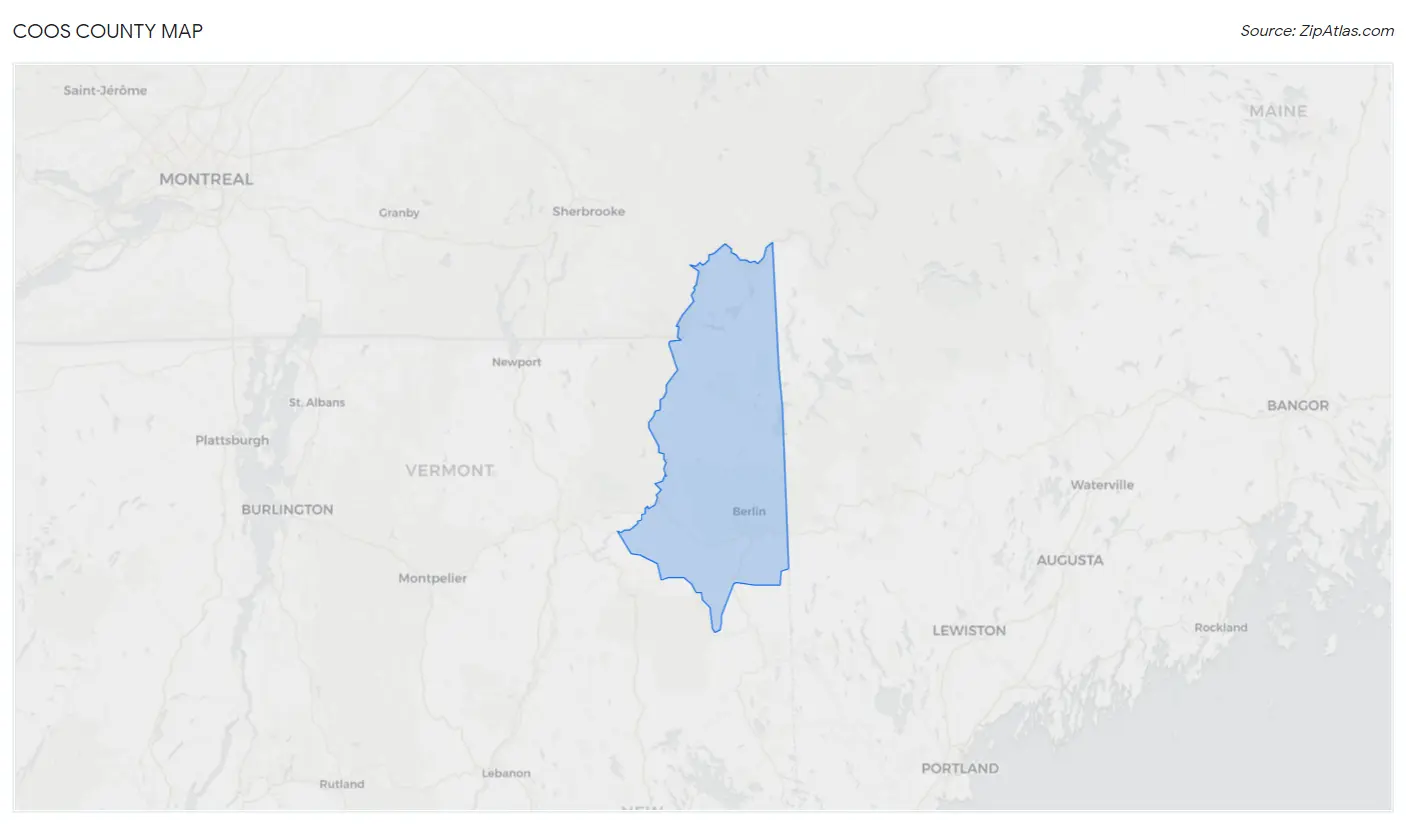
Coos County Map
Coos County Overview
$32,570
PER CAPITA INCOME
$74,857
AVG FAMILY INCOME
$55,247
AVG HOUSEHOLD INCOME
22.2%
WAGE / INCOME GAP [ % ]
77.8¢/ $1
WAGE / INCOME GAP [ $ ]
$9,729
FAMILY INCOME DEFICIT
0.43
INEQUALITY / GINI INDEX
31,430
TOTAL POPULATION
16,638
MALE POPULATION
14,792
FEMALE POPULATION
112.48
MALES / 100 FEMALES
88.90
FEMALES / 100 MALES
49.7
MEDIAN AGE
2.7
AVG FAMILY SIZE
2.2
AVG HOUSEHOLD SIZE
15,083
LABOR FORCE [ PEOPLE ]
55.5%
PERCENT IN LABOR FORCE
4.2%
UNEMPLOYMENT RATE
Coos County Area Codes
Income in Coos County
Income Overview in Coos County
Per Capita Income in Coos County is $32,570, while median incomes of families and households are $74,857 and $55,247 respectively.
| Characteristic | Number | Measure |
| Per Capita Income | 31,430 | $32,570 |
| Median Family Income | 8,096 | $74,857 |
| Mean Family Income | 8,096 | $89,661 |
| Median Household Income | 13,620 | $55,247 |
| Mean Household Income | 13,620 | $73,318 |
| Income Deficit | 8,096 | $9,729 |
| Wage / Income Gap (%) | 31,430 | 22.18% |
| Wage / Income Gap ($) | 31,430 | 77.82¢ per $1 |
| Gini / Inequality Index | 31,430 | 0.43 |
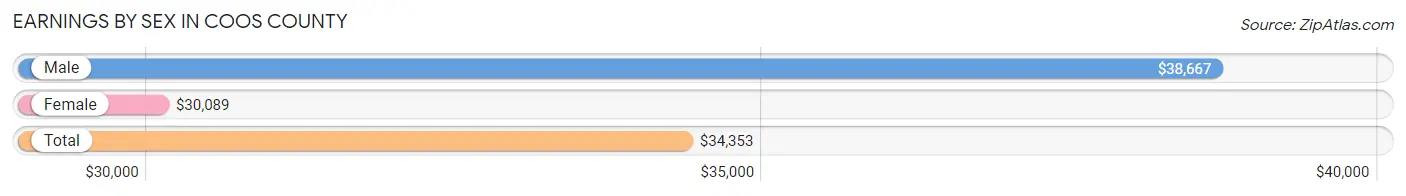
Earnings by Sex in Coos County
Average Earnings in Coos County are $34,353, $38,667 for men and $30,089 for women, a difference of 22.2%.
| Sex | Number | Average Earnings |
| Male | 8,630 (53.3%) | $38,667 |
| Female | 7,568 (46.7%) | $30,089 |
| Total | 16,198 (100.0%) | $34,353 |
Earnings by Sex by Income Bracket in Coos County
The most common earnings brackets in Coos County are $100,000+ for men (795 | 9.2%) and $35,000 to $39,999 for women (583 | 7.7%).

| Income | Male | Female |
| $2,499 or less | 364 (4.2%) | 516 (6.8%) |
| $2,500 to $4,999 | 371 (4.3%) | 457 (6.0%) |
| $5,000 to $7,499 | 316 (3.7%) | 348 (4.6%) |
| $7,500 to $9,999 | 244 (2.8%) | 204 (2.7%) |
| $10,000 to $12,499 | 257 (3.0%) | 242 (3.2%) |
| $12,500 to $14,999 | 211 (2.4%) | 269 (3.5%) |
| $15,000 to $17,499 | 244 (2.8%) | 274 (3.6%) |
| $17,500 to $19,999 | 272 (3.2%) | 173 (2.3%) |
| $20,000 to $22,499 | 159 (1.8%) | 333 (4.4%) |
| $22,500 to $24,999 | 369 (4.3%) | 430 (5.7%) |
| $25,000 to $29,999 | 552 (6.4%) | 528 (7.0%) |
| $30,000 to $34,999 | 541 (6.3%) | 582 (7.7%) |
| $35,000 to $39,999 | 536 (6.2%) | 583 (7.7%) |
| $40,000 to $44,999 | 525 (6.1%) | 430 (5.7%) |
| $45,000 to $49,999 | 500 (5.8%) | 371 (4.9%) |
| $50,000 to $54,999 | 390 (4.5%) | 311 (4.1%) |
| $55,000 to $64,999 | 671 (7.8%) | 504 (6.7%) |
| $65,000 to $74,999 | 586 (6.8%) | 387 (5.1%) |
| $75,000 to $99,999 | 727 (8.4%) | 390 (5.1%) |
| $100,000+ | 795 (9.2%) | 236 (3.1%) |
| Total | 8,630 (100.0%) | 7,568 (100.0%) |
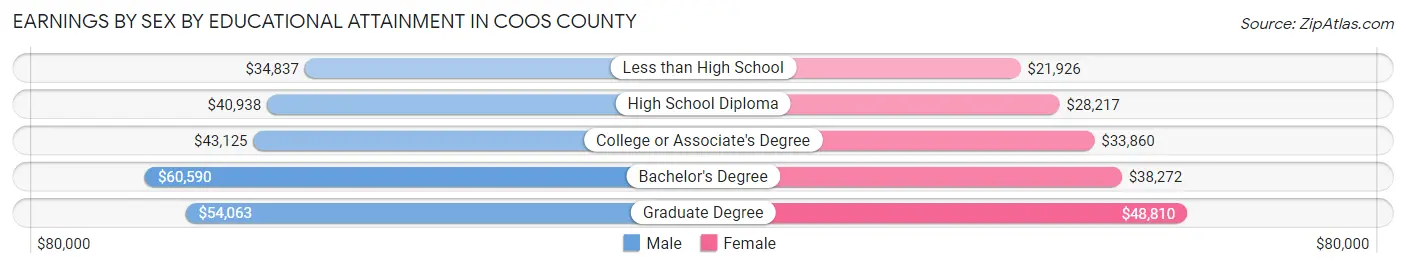
Earnings by Sex by Educational Attainment in Coos County
Average earnings in Coos County are $42,680 for men and $33,559 for women, a difference of 21.4%. Men with an educational attainment of bachelor's degree enjoy the highest average annual earnings of $60,590, while those with less than high school education earn the least with $34,837. Women with an educational attainment of graduate degree earn the most with the average annual earnings of $48,810, while those with less than high school education have the smallest earnings of $21,926.
| Educational Attainment | Male Income | Female Income |
| Less than High School | $34,837 | $21,926 |
| High School Diploma | $40,938 | $28,217 |
| College or Associate's Degree | $43,125 | $33,860 |
| Bachelor's Degree | $60,590 | $38,272 |
| Graduate Degree | $54,063 | $48,810 |
| Total | $42,680 | $33,559 |
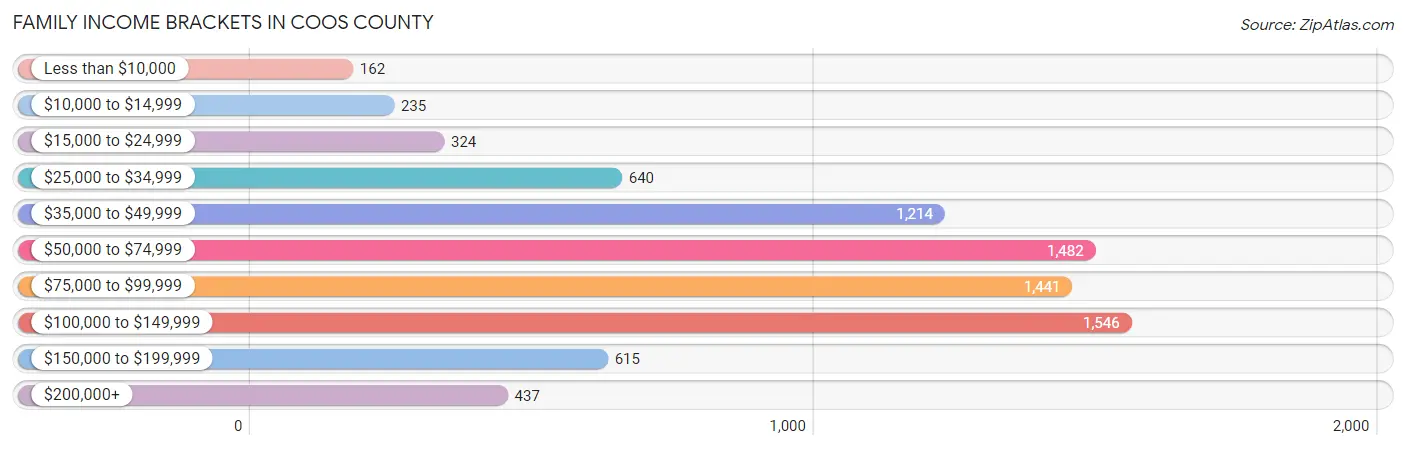
Family Income in Coos County
Family Income Brackets in Coos County
According to the Coos County family income data, there are 1,546 families falling into the $100,000 to $149,999 income range, which is the most common income bracket and makes up 19.1% of all families. Conversely, the less than $10,000 income bracket is the least frequent group with only 162 families (2.0%) belonging to this category.
| Income Bracket | # Families | % Families |
| Less than $10,000 | 162 | 2.0% |
| $10,000 to $14,999 | 235 | 2.9% |
| $15,000 to $24,999 | 324 | 4.0% |
| $25,000 to $34,999 | 640 | 7.9% |
| $35,000 to $49,999 | 1,214 | 15.0% |
| $50,000 to $74,999 | 1,482 | 18.3% |
| $75,000 to $99,999 | 1,441 | 17.8% |
| $100,000 to $149,999 | 1,546 | 19.1% |
| $150,000 to $199,999 | 615 | 7.6% |
| $200,000+ | 437 | 5.4% |
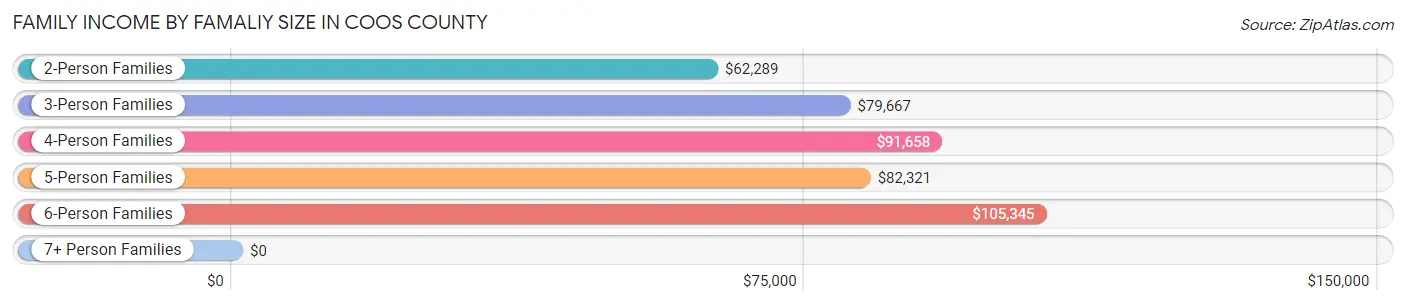
Family Income by Famaliy Size in Coos County
6-person families (56 | 0.7%) account for the highest median family income in Coos County with $105,345 per family, while 2-person families (4,848 | 59.9%) have the highest median income of $31,144 per family member.
| Income Bracket | # Families | Median Income |
| 2-Person Families | 4,848 (59.9%) | $62,289 |
| 3-Person Families | 1,836 (22.7%) | $79,667 |
| 4-Person Families | 923 (11.4%) | $91,658 |
| 5-Person Families | 347 (4.3%) | $82,321 |
| 6-Person Families | 56 (0.7%) | $105,345 |
| 7+ Person Families | 86 (1.1%) | $0 |
| Total | 8,096 (100.0%) | $74,857 |
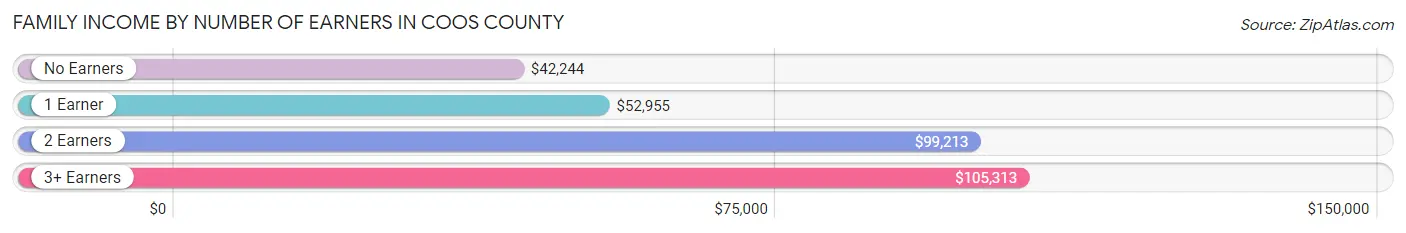
Family Income by Number of Earners in Coos County
The median family income in Coos County is $74,857, with families comprising 3+ earners (954) having the highest median family income of $105,313, while families with no earners (1,720) have the lowest median family income of $42,244, accounting for 11.8% and 21.2% of families, respectively.
| Number of Earners | # Families | Median Income |
| No Earners | 1,720 (21.2%) | $42,244 |
| 1 Earner | 2,462 (30.4%) | $52,955 |
| 2 Earners | 2,960 (36.6%) | $99,213 |
| 3+ Earners | 954 (11.8%) | $105,313 |
| Total | 8,096 (100.0%) | $74,857 |
Household Income in Coos County
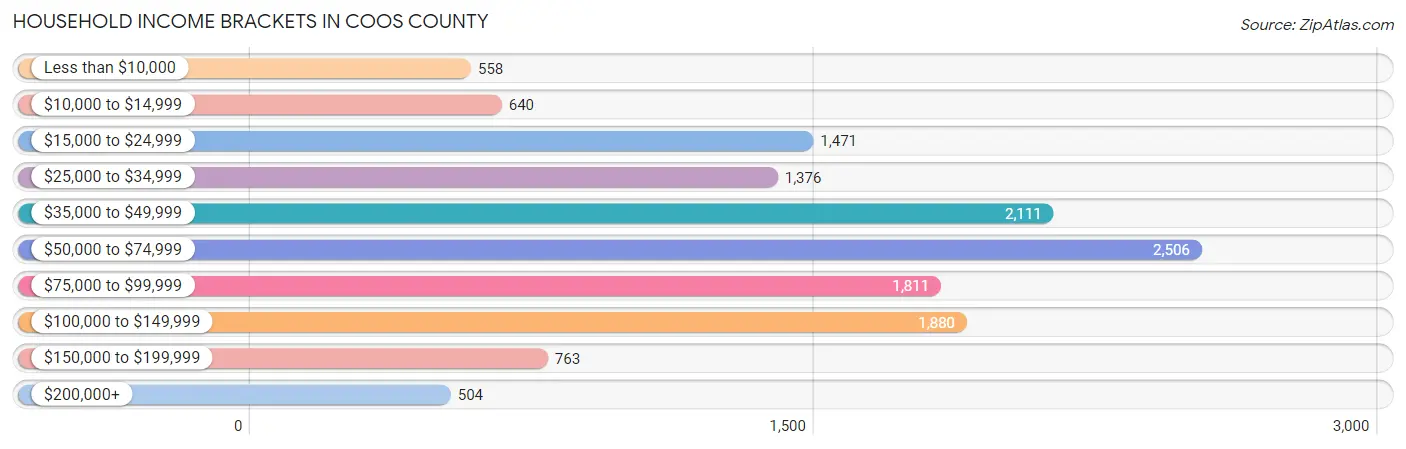
Household Income Brackets in Coos County
With 2,506 households falling in the category, the $50,000 to $74,999 income range is the most frequent in Coos County, accounting for 18.4% of all households. In contrast, only 504 households (3.7%) fall into the $200,000+ income bracket, making it the least populous group.
| Income Bracket | # Households | % Households |
| Less than $10,000 | 558 | 4.1% |
| $10,000 to $14,999 | 640 | 4.7% |
| $15,000 to $24,999 | 1,471 | 10.8% |
| $25,000 to $34,999 | 1,376 | 10.1% |
| $35,000 to $49,999 | 2,111 | 15.5% |
| $50,000 to $74,999 | 2,506 | 18.4% |
| $75,000 to $99,999 | 1,811 | 13.3% |
| $100,000 to $149,999 | 1,880 | 13.8% |
| $150,000 to $199,999 | 763 | 5.6% |
| $200,000+ | 504 | 3.7% |
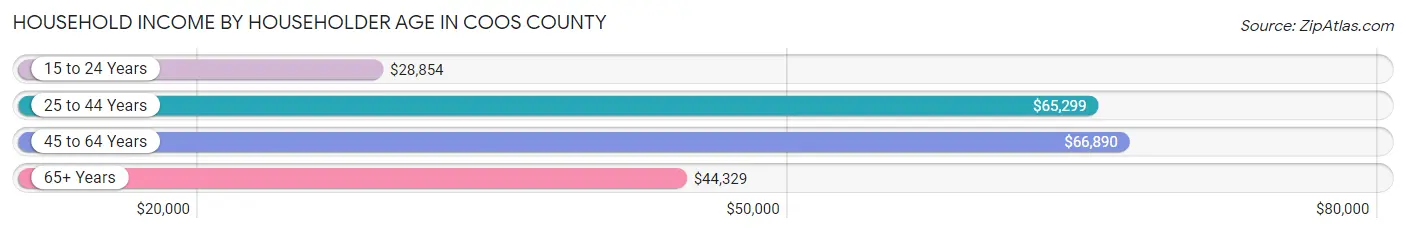
Household Income by Householder Age in Coos County
The median household income in Coos County is $55,247, with the highest median household income of $66,890 found in the 45 to 64 years age bracket for the primary householder. A total of 5,194 households (38.1%) fall into this category. Meanwhile, the 15 to 24 years age bracket for the primary householder has the lowest median household income of $28,854, with 405 households (3.0%) in this group.
| Income Bracket | # Households | Median Income |
| 15 to 24 Years | 405 (3.0%) | $28,854 |
| 25 to 44 Years | 2,944 (21.6%) | $65,299 |
| 45 to 64 Years | 5,194 (38.1%) | $66,890 |
| 65+ Years | 5,077 (37.3%) | $44,329 |
| Total | 13,620 (100.0%) | $55,247 |
Poverty in Coos County
Income Below Poverty by Sex and Age in Coos County
With 10.6% poverty level for males and 12.7% for females among the residents of Coos County, under 5 year old males and 25 to 34 year old females are the most vulnerable to poverty, with 108 males (17.9%) and 376 females (26.8%) in their respective age groups living below the poverty level.
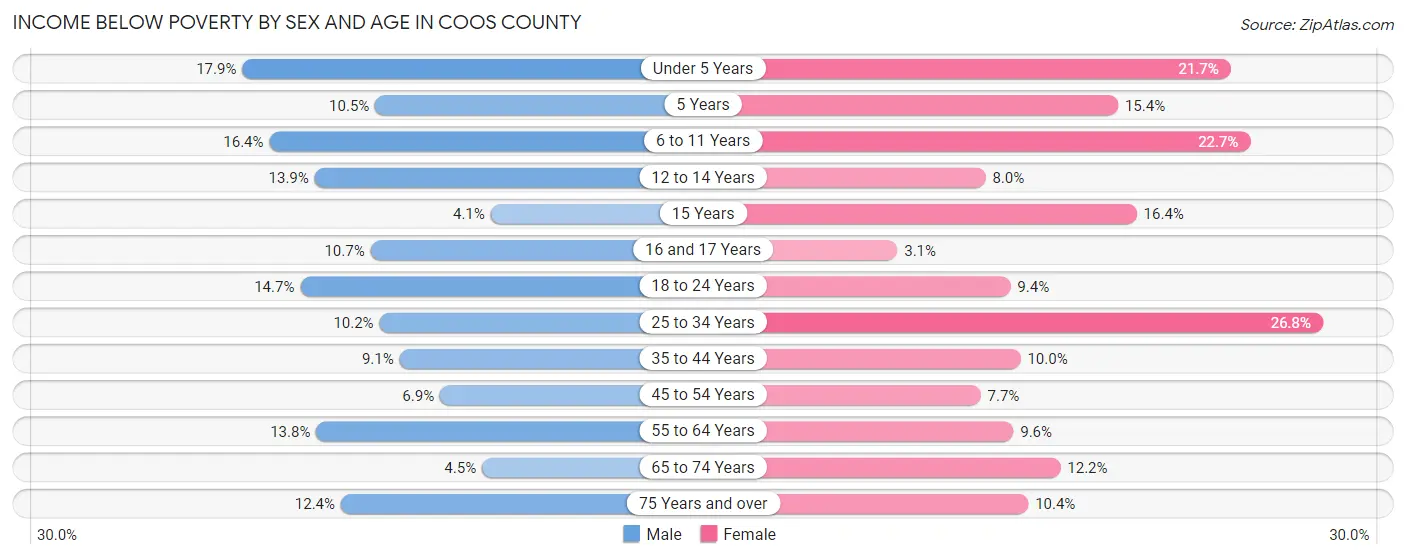
| Age Bracket | Male | Female |
| Under 5 Years | 108 (17.9%) | 123 (21.6%) |
| 5 Years | 11 (10.5%) | 24 (15.4%) |
| 6 to 11 Years | 119 (16.4%) | 181 (22.7%) |
| 12 to 14 Years | 77 (13.9%) | 22 (8.0%) |
| 15 Years | 7 (4.1%) | 22 (16.4%) |
| 16 and 17 Years | 35 (10.7%) | 10 (3.1%) |
| 18 to 24 Years | 155 (14.6%) | 83 (9.4%) |
| 25 to 34 Years | 173 (10.2%) | 376 (26.8%) |
| 35 to 44 Years | 143 (9.1%) | 148 (10.0%) |
| 45 to 54 Years | 138 (6.9%) | 144 (7.7%) |
| 55 to 64 Years | 368 (13.8%) | 251 (9.6%) |
| 65 to 74 Years | 106 (4.5%) | 274 (12.2%) |
| 75 Years and over | 156 (12.4%) | 165 (10.4%) |
| Total | 1,596 (10.6%) | 1,823 (12.7%) |
Income Above Poverty by Sex and Age in Coos County
According to the poverty statistics in Coos County, males aged 15 years and females aged 16 and 17 years are the age groups that are most secure financially, with 96.0% of males and 96.9% of females in these age groups living above the poverty line.
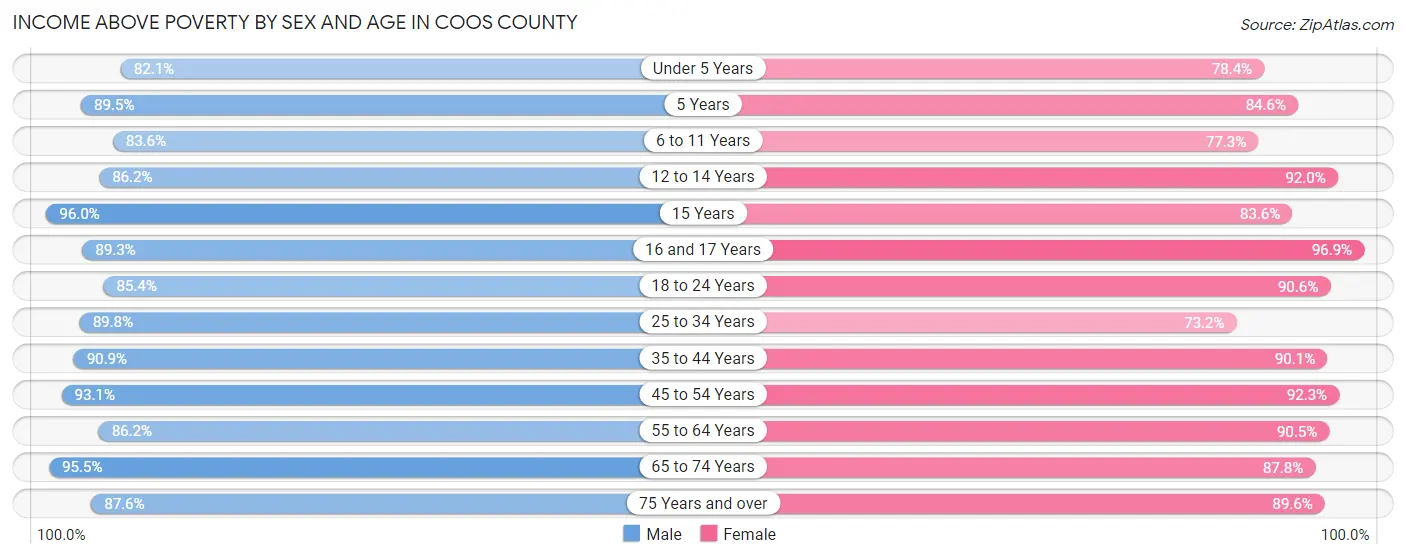
| Age Bracket | Male | Female |
| Under 5 Years | 496 (82.1%) | 445 (78.3%) |
| 5 Years | 94 (89.5%) | 132 (84.6%) |
| 6 to 11 Years | 608 (83.6%) | 615 (77.3%) |
| 12 to 14 Years | 479 (86.2%) | 253 (92.0%) |
| 15 Years | 166 (96.0%) | 112 (83.6%) |
| 16 and 17 Years | 291 (89.3%) | 314 (96.9%) |
| 18 to 24 Years | 903 (85.4%) | 801 (90.6%) |
| 25 to 34 Years | 1,516 (89.8%) | 1,028 (73.2%) |
| 35 to 44 Years | 1,425 (90.9%) | 1,339 (90.0%) |
| 45 to 54 Years | 1,871 (93.1%) | 1,720 (92.3%) |
| 55 to 64 Years | 2,306 (86.2%) | 2,377 (90.4%) |
| 65 to 74 Years | 2,232 (95.5%) | 1,977 (87.8%) |
| 75 Years and over | 1,103 (87.6%) | 1,425 (89.6%) |
| Total | 13,490 (89.4%) | 12,538 (87.3%) |
Income Below Poverty Among Married-Couple Families in Coos County
The poverty statistics for married-couple families in Coos County show that 4.4% or 285 of the total 6,446 families live below the poverty line. Families with 5 or more children have the highest poverty rate of 7.4%, comprising of 2 families. On the other hand, families with 3 or 4 children have the lowest poverty rate of 0.0%, which includes 0 families.
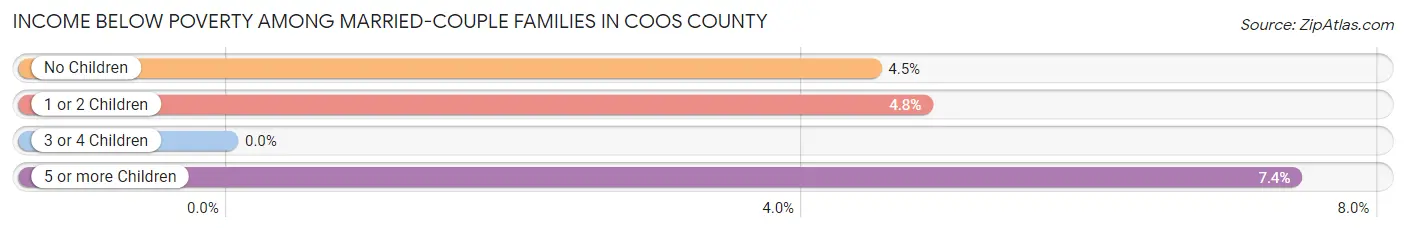
| Children | Above Poverty | Below Poverty |
| No Children | 4,432 (95.5%) | 208 (4.5%) |
| 1 or 2 Children | 1,474 (95.2%) | 75 (4.8%) |
| 3 or 4 Children | 230 (100.0%) | 0 (0.0%) |
| 5 or more Children | 25 (92.6%) | 2 (7.4%) |
| Total | 6,161 (95.6%) | 285 (4.4%) |
Income Below Poverty Among Single-Parent Households in Coos County
According to the poverty data in Coos County, 10.8% or 56 single-father households and 17.9% or 202 single-mother households are living below the poverty line. Among single-father households, those with 1 or 2 children have the highest poverty rate, with 51 households (16.4%) experiencing poverty. Likewise, among single-mother households, those with 3 or 4 children have the highest poverty rate, with 68 households (80.0%) falling below the poverty line.
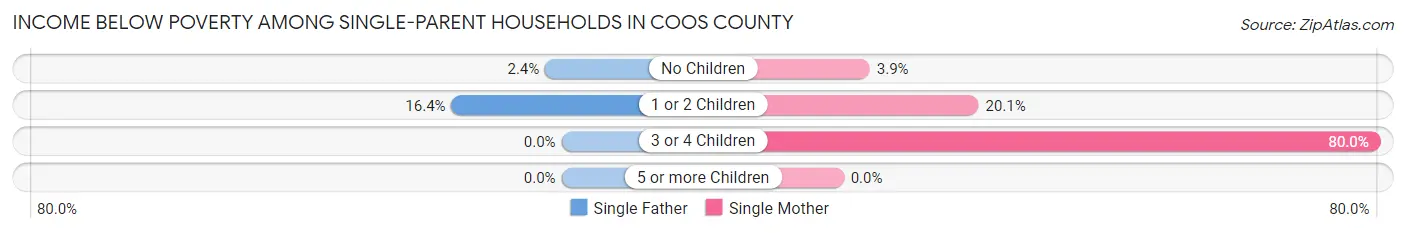
| Children | Single Father | Single Mother |
| No Children | 5 (2.4%) | 17 (3.9%) |
| 1 or 2 Children | 51 (16.4%) | 117 (20.1%) |
| 3 or 4 Children | 0 (0.0%) | 68 (80.0%) |
| 5 or more Children | 0 (0.0%) | 0 (0.0%) |
| Total | 56 (10.8%) | 202 (17.9%) |
Income Below Poverty Among Married-Couple vs Single-Parent Households in Coos County
The poverty data for Coos County shows that 285 of the married-couple family households (4.4%) and 258 of the single-parent households (15.6%) are living below the poverty level. Within the married-couple family households, those with 5 or more children have the highest poverty rate, with 2 households (7.4%) falling below the poverty line. Among the single-parent households, those with 3 or 4 children have the highest poverty rate, with 68 household (77.3%) living below poverty.
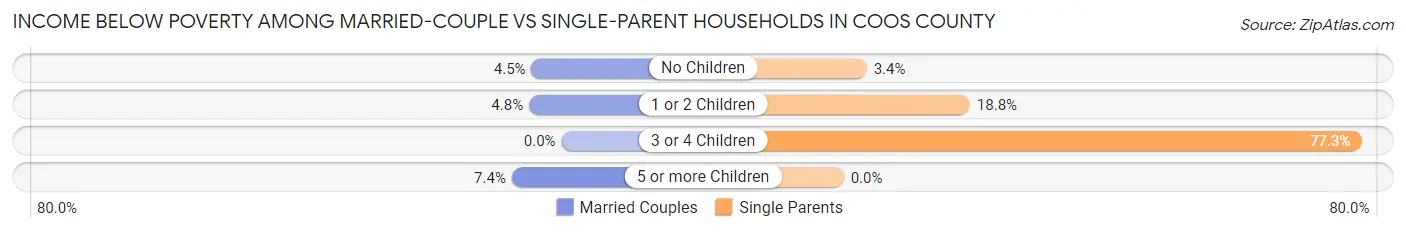
| Children | Married-Couple Families | Single-Parent Households |
| No Children | 208 (4.5%) | 22 (3.4%) |
| 1 or 2 Children | 75 (4.8%) | 168 (18.8%) |
| 3 or 4 Children | 0 (0.0%) | 68 (77.3%) |
| 5 or more Children | 2 (7.4%) | 0 (0.0%) |
| Total | 285 (4.4%) | 258 (15.6%) |
Race in Coos County
The most populous races in Coos County are White / Caucasian (29,979 | 95.4%), Black / African American (634 | 2.0%), and Hispanic or Latino (589 | 1.9%).
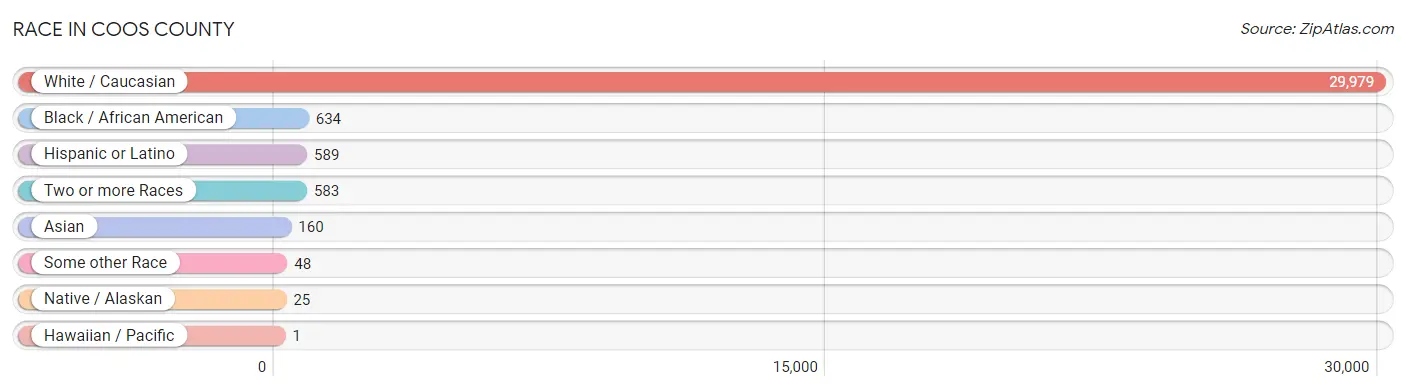
| Race | # Population | % Population |
| Asian | 160 | 0.5% |
| Black / African American | 634 | 2.0% |
| Hawaiian / Pacific | 1 | 0.0% |
| Hispanic or Latino | 589 | 1.9% |
| Native / Alaskan | 25 | 0.1% |
| White / Caucasian | 29,979 | 95.4% |
| Two or more Races | 583 | 1.8% |
| Some other Race | 48 | 0.2% |
| Total | 31,430 | 100.0% |
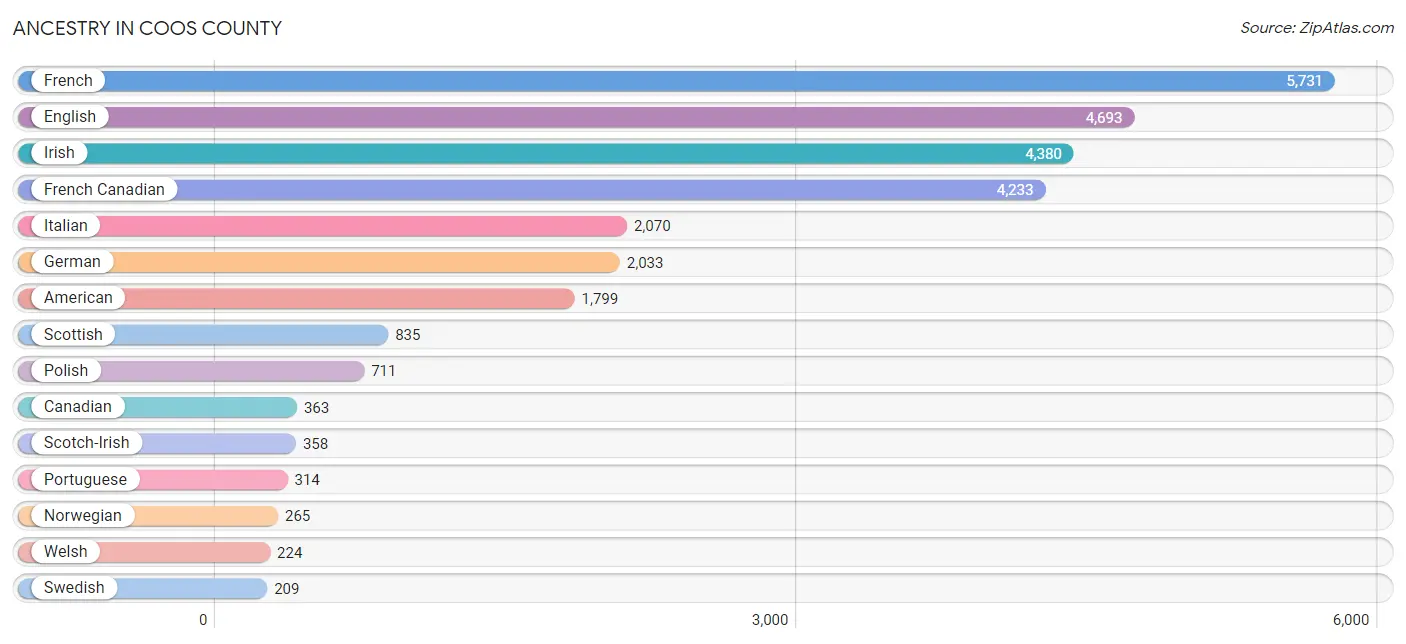
Ancestry in Coos County
The most populous ancestries reported in Coos County are French (5,731 | 18.2%), English (4,693 | 14.9%), Irish (4,380 | 13.9%), French Canadian (4,233 | 13.5%), and Italian (2,070 | 6.6%), together accounting for 67.2% of all Coos County residents.
| Ancestry | # Population | % Population |
| African | 32 | 0.1% |
| Albanian | 2 | 0.0% |
| American | 1,799 | 5.7% |
| Arab | 25 | 0.1% |
| Armenian | 1 | 0.0% |
| Australian | 3 | 0.0% |
| Austrian | 10 | 0.0% |
| Belgian | 63 | 0.2% |
| Bhutanese | 107 | 0.3% |
| Brazilian | 23 | 0.1% |
| British | 146 | 0.5% |
| Burmese | 67 | 0.2% |
| Cajun | 6 | 0.0% |
| Canadian | 363 | 1.1% |
| Cape Verdean | 17 | 0.1% |
| Celtic | 3 | 0.0% |
| Central American | 46 | 0.2% |
| Central American Indian | 3 | 0.0% |
| Cherokee | 20 | 0.1% |
| Chilean | 45 | 0.1% |
| Chippewa | 1 | 0.0% |
| Colombian | 4 | 0.0% |
| Cree | 23 | 0.1% |
| Cuban | 9 | 0.0% |
| Czech | 30 | 0.1% |
| Czechoslovakian | 32 | 0.1% |
| Danish | 55 | 0.2% |
| Dominican | 4 | 0.0% |
| Dutch | 114 | 0.4% |
| Eastern European | 41 | 0.1% |
| Egyptian | 6 | 0.0% |
| English | 4,693 | 14.9% |
| European | 162 | 0.5% |
| Finnish | 113 | 0.4% |
| French | 5,731 | 18.2% |
| French American Indian | 5 | 0.0% |
| French Canadian | 4,233 | 13.5% |
| German | 2,033 | 6.5% |
| Greek | 56 | 0.2% |
| Guatemalan | 3 | 0.0% |
| Haitian | 1 | 0.0% |
| Honduran | 11 | 0.0% |
| Hungarian | 63 | 0.2% |
| Indian (Asian) | 29 | 0.1% |
| Irish | 4,380 | 13.9% |
| Iroquois | 38 | 0.1% |
| Italian | 2,070 | 6.6% |
| Jamaican | 8 | 0.0% |
| Japanese | 3 | 0.0% |
| Korean | 12 | 0.0% |
| Laotian | 24 | 0.1% |
| Latvian | 8 | 0.0% |
| Lebanese | 19 | 0.1% |
| Lithuanian | 79 | 0.3% |
| Mexican | 67 | 0.2% |
| Native Hawaiian | 1 | 0.0% |
| Northern European | 92 | 0.3% |
| Norwegian | 265 | 0.8% |
| Panamanian | 7 | 0.0% |
| Paraguayan | 5 | 0.0% |
| Polish | 711 | 2.3% |
| Portuguese | 314 | 1.0% |
| Puerto Rican | 132 | 0.4% |
| Romanian | 3 | 0.0% |
| Russian | 203 | 0.6% |
| Salvadoran | 25 | 0.1% |
| Scandinavian | 107 | 0.3% |
| Scotch-Irish | 358 | 1.1% |
| Scottish | 835 | 2.7% |
| Serbian | 17 | 0.1% |
| Slavic | 14 | 0.0% |
| Slovak | 6 | 0.0% |
| South American | 59 | 0.2% |
| Spanish | 22 | 0.1% |
| Sri Lankan | 9 | 0.0% |
| Subsaharan African | 49 | 0.2% |
| Swedish | 209 | 0.7% |
| Swiss | 59 | 0.2% |
| Syrian | 6 | 0.0% |
| Thai | 17 | 0.1% |
| Ukrainian | 29 | 0.1% |
| Uruguayan | 1 | 0.0% |
| Ute | 2 | 0.0% |
| Venezuelan | 4 | 0.0% |
| Welsh | 224 | 0.7% | View All 85 Rows |
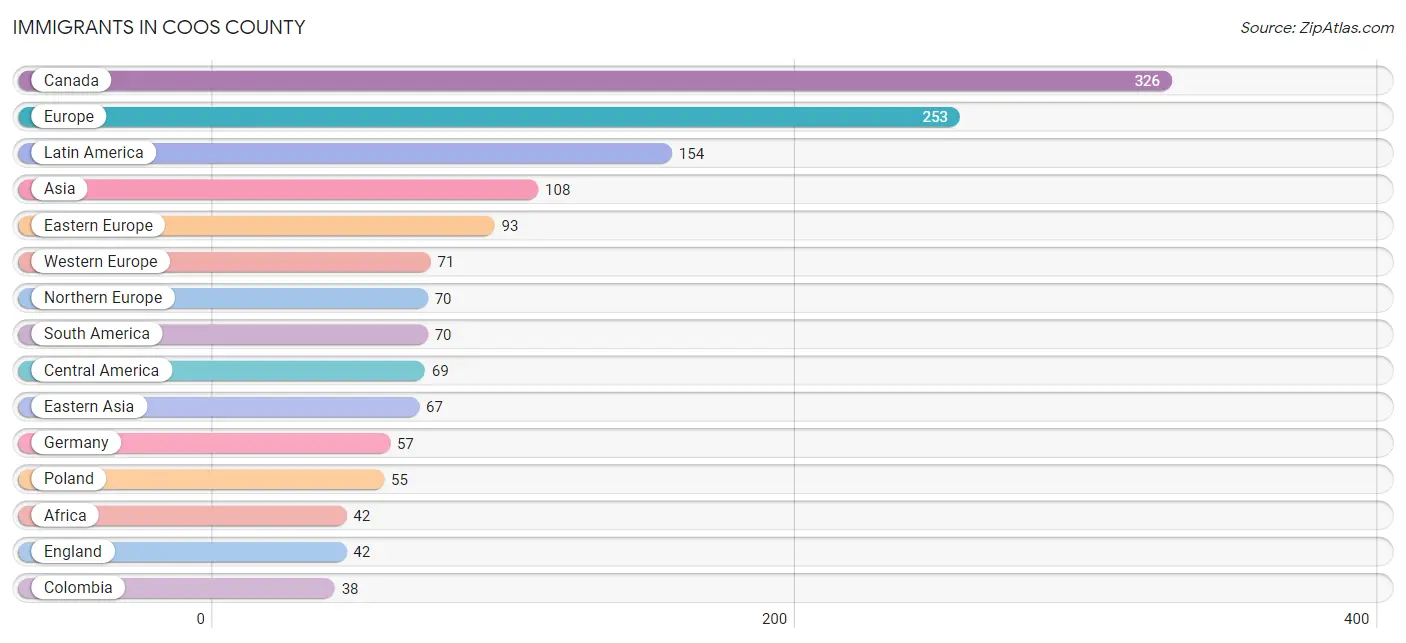
Immigrants in Coos County
The most numerous immigrant groups reported in Coos County came from Canada (326 | 1.0%), Europe (253 | 0.8%), Latin America (154 | 0.5%), Asia (108 | 0.3%), and Eastern Europe (93 | 0.3%), together accounting for 3.0% of all Coos County residents.
| Immigration Origin | # Population | % Population |
| Africa | 42 | 0.1% |
| Asia | 108 | 0.3% |
| Brazil | 25 | 0.1% |
| Bulgaria | 9 | 0.0% |
| Canada | 326 | 1.0% |
| Caribbean | 15 | 0.1% |
| Central America | 69 | 0.2% |
| China | 16 | 0.1% |
| Colombia | 38 | 0.1% |
| Dominican Republic | 15 | 0.1% |
| Eastern Asia | 67 | 0.2% |
| Eastern Europe | 93 | 0.3% |
| El Salvador | 21 | 0.1% |
| England | 42 | 0.1% |
| Europe | 253 | 0.8% |
| France | 12 | 0.0% |
| Germany | 57 | 0.2% |
| Greece | 2 | 0.0% |
| Guatemala | 20 | 0.1% |
| Honduras | 5 | 0.0% |
| Hong Kong | 14 | 0.0% |
| Hungary | 2 | 0.0% |
| India | 9 | 0.0% |
| Indonesia | 15 | 0.1% |
| Italy | 12 | 0.0% |
| Japan | 15 | 0.1% |
| Jordan | 9 | 0.0% |
| Korea | 36 | 0.1% |
| Latin America | 154 | 0.5% |
| Mexico | 19 | 0.1% |
| Netherlands | 2 | 0.0% |
| Nigeria | 26 | 0.1% |
| Northern Africa | 7 | 0.0% |
| Northern Europe | 70 | 0.2% |
| Oceania | 14 | 0.0% |
| Panama | 4 | 0.0% |
| Philippines | 5 | 0.0% |
| Poland | 55 | 0.2% |
| Portugal | 5 | 0.0% |
| Romania | 3 | 0.0% |
| Russia | 7 | 0.0% |
| Scotland | 18 | 0.1% |
| Serbia | 17 | 0.1% |
| South Africa | 9 | 0.0% |
| South America | 70 | 0.2% |
| South Central Asia | 9 | 0.0% |
| South Eastern Asia | 20 | 0.1% |
| Southern Europe | 19 | 0.1% |
| Sudan | 7 | 0.0% |
| Sweden | 1 | 0.0% |
| Taiwan | 2 | 0.0% |
| Turkey | 3 | 0.0% |
| Uruguay | 1 | 0.0% |
| Venezuela | 6 | 0.0% |
| Western Africa | 26 | 0.1% |
| Western Asia | 12 | 0.0% |
| Western Europe | 71 | 0.2% | View All 57 Rows |
Sex and Age in Coos County
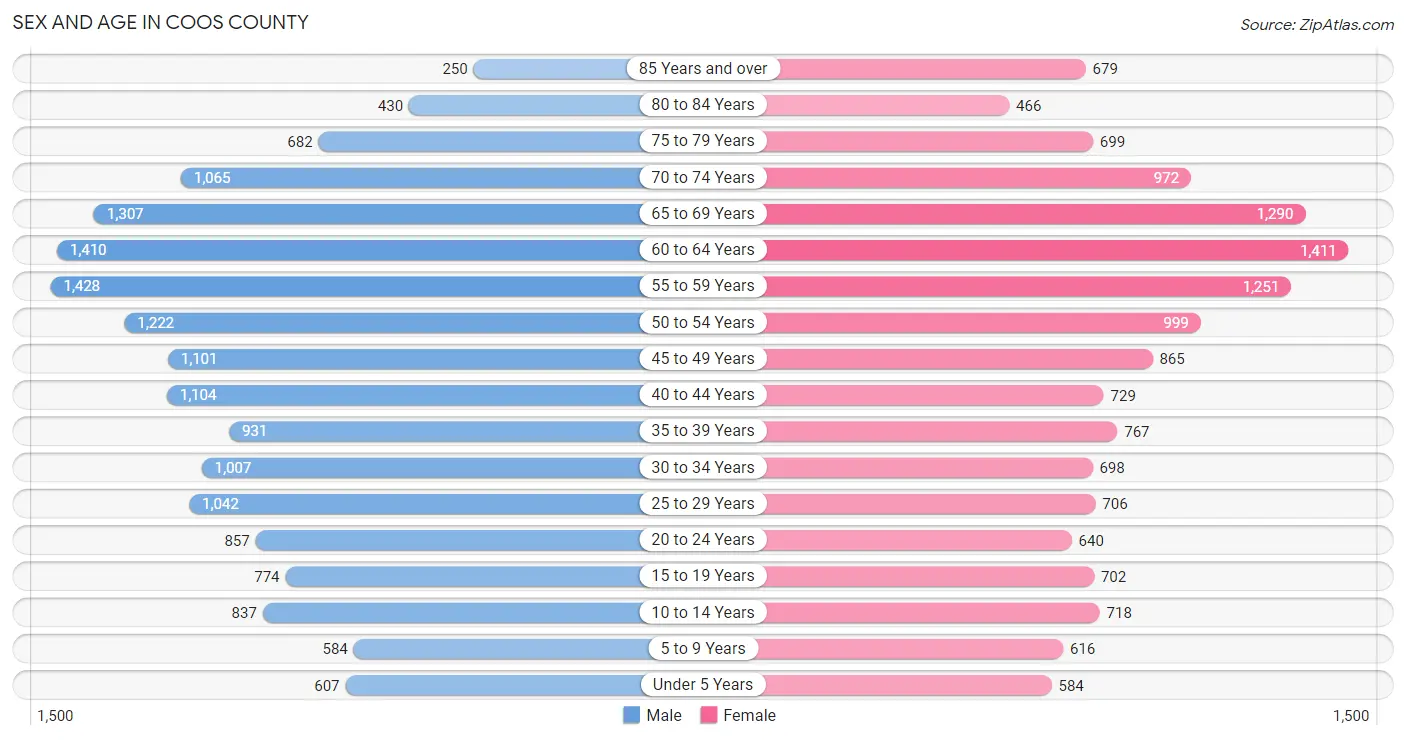
Sex and Age in Coos County
The most populous age groups in Coos County are 55 to 59 Years (1,428 | 8.6%) for men and 60 to 64 Years (1,411 | 9.5%) for women.
| Age Bracket | Male | Female |
| Under 5 Years | 607 (3.6%) | 584 (4.0%) |
| 5 to 9 Years | 584 (3.5%) | 616 (4.2%) |
| 10 to 14 Years | 837 (5.0%) | 718 (4.9%) |
| 15 to 19 Years | 774 (4.6%) | 702 (4.8%) |
| 20 to 24 Years | 857 (5.1%) | 640 (4.3%) |
| 25 to 29 Years | 1,042 (6.3%) | 706 (4.8%) |
| 30 to 34 Years | 1,007 (6.0%) | 698 (4.7%) |
| 35 to 39 Years | 931 (5.6%) | 767 (5.2%) |
| 40 to 44 Years | 1,104 (6.6%) | 729 (4.9%) |
| 45 to 49 Years | 1,101 (6.6%) | 865 (5.9%) |
| 50 to 54 Years | 1,222 (7.3%) | 999 (6.8%) |
| 55 to 59 Years | 1,428 (8.6%) | 1,251 (8.5%) |
| 60 to 64 Years | 1,410 (8.5%) | 1,411 (9.5%) |
| 65 to 69 Years | 1,307 (7.9%) | 1,290 (8.7%) |
| 70 to 74 Years | 1,065 (6.4%) | 972 (6.6%) |
| 75 to 79 Years | 682 (4.1%) | 699 (4.7%) |
| 80 to 84 Years | 430 (2.6%) | 466 (3.2%) |
| 85 Years and over | 250 (1.5%) | 679 (4.6%) |
| Total | 16,638 (100.0%) | 14,792 (100.0%) |
Families and Households in Coos County
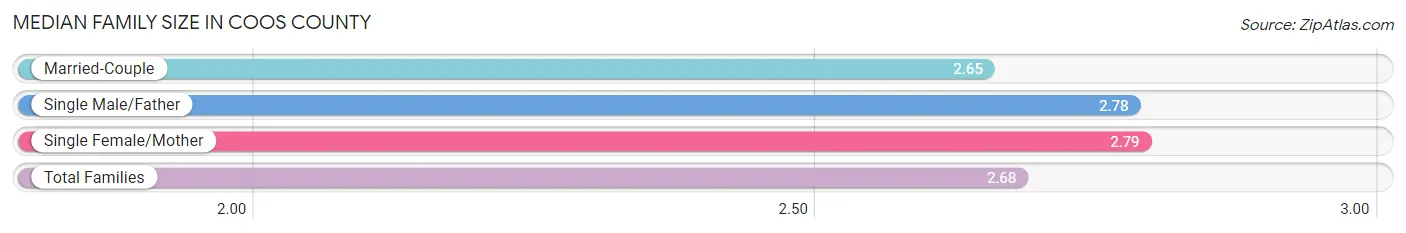
Median Family Size in Coos County
The median family size in Coos County is 2.68 persons per family, with single female/mother families (1,131 | 14.0%) accounting for the largest median family size of 2.79 persons per family. On the other hand, married-couple families (6,446 | 79.6%) represent the smallest median family size with 2.65 persons per family.
| Family Type | # Families | Family Size |
| Married-Couple | 6,446 (79.6%) | 2.65 |
| Single Male/Father | 519 (6.4%) | 2.78 |
| Single Female/Mother | 1,131 (14.0%) | 2.79 |
| Total Families | 8,096 (100.0%) | 2.68 |
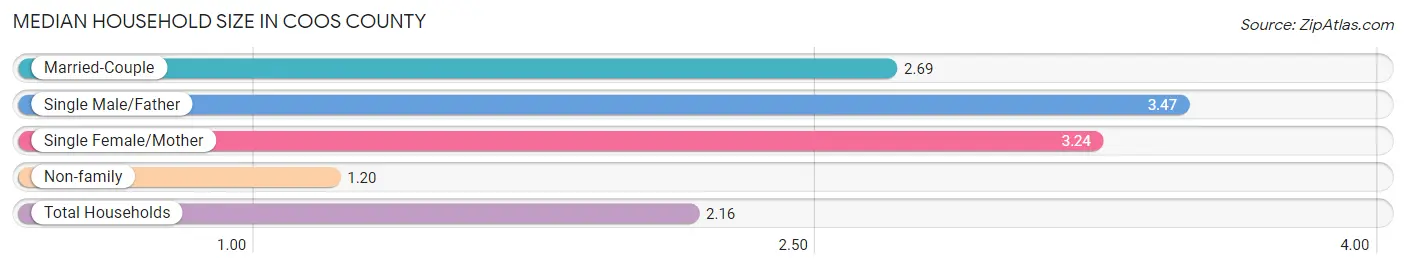
Median Household Size in Coos County
The median household size in Coos County is 2.16 persons per household, with single male/father households (519 | 3.8%) accounting for the largest median household size of 3.47 persons per household. non-family households (5,524 | 40.6%) represent the smallest median household size with 1.20 persons per household.
| Household Type | # Households | Household Size |
| Married-Couple | 6,446 (47.3%) | 2.69 |
| Single Male/Father | 519 (3.8%) | 3.47 |
| Single Female/Mother | 1,131 (8.3%) | 3.24 |
| Non-family | 5,524 (40.6%) | 1.20 |
| Total Households | 13,620 (100.0%) | 2.16 |
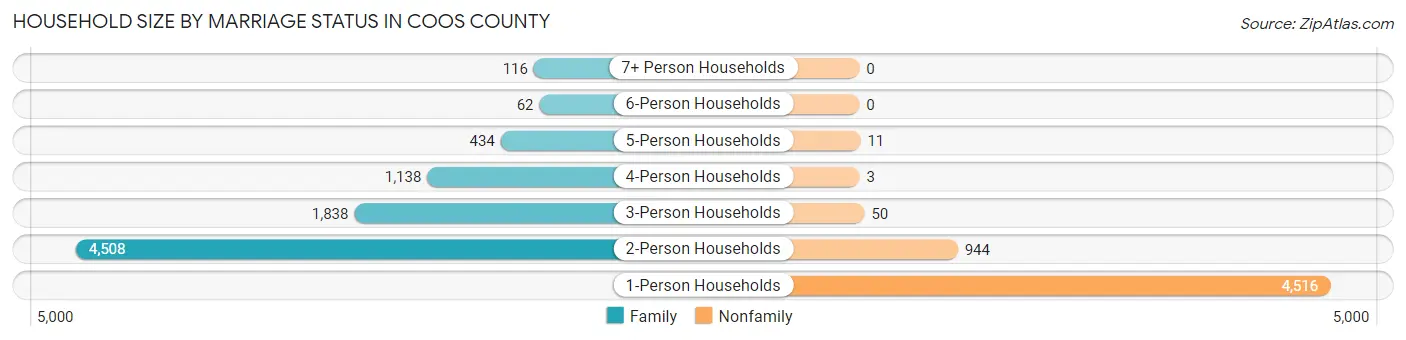
Household Size by Marriage Status in Coos County
Out of a total of 13,620 households in Coos County, 8,096 (59.4%) are family households, while 5,524 (40.6%) are nonfamily households. The most numerous type of family households are 2-person households, comprising 4,508, and the most common type of nonfamily households are 1-person households, comprising 4,516.
| Household Size | Family Households | Nonfamily Households |
| 1-Person Households | - | 4,516 (33.2%) |
| 2-Person Households | 4,508 (33.1%) | 944 (6.9%) |
| 3-Person Households | 1,838 (13.5%) | 50 (0.4%) |
| 4-Person Households | 1,138 (8.4%) | 3 (0.0%) |
| 5-Person Households | 434 (3.2%) | 11 (0.1%) |
| 6-Person Households | 62 (0.5%) | 0 (0.0%) |
| 7+ Person Households | 116 (0.9%) | 0 (0.0%) |
| Total | 8,096 (59.4%) | 5,524 (40.6%) |
Female Fertility in Coos County
Fertility by Age in Coos County
Average fertility rate in Coos County is 52.0 births per 1,000 women. Women in the age bracket of 20 to 34 years have the highest fertility rate with 125.0 births per 1,000 women. Women in the age bracket of 20 to 34 years acount for 92.1% of all women with births.
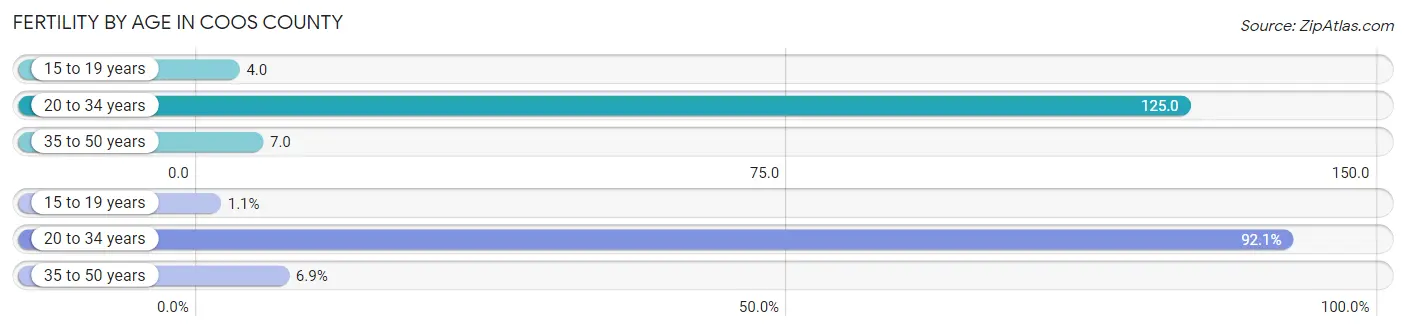
| Age Bracket | Women with Births | Births / 1,000 Women |
| 15 to 19 years | 3 (1.1%) | 4.0 |
| 20 to 34 years | 255 (92.1%) | 125.0 |
| 35 to 50 years | 19 (6.9%) | 7.0 |
| Total | 277 (100.0%) | 52.0 |
Fertility by Age by Marriage Status in Coos County
39.4% of women with births (277) in Coos County are married. The highest percentage of unmarried women with births falls into 15 to 19 years age bracket with 100.0% of them unmarried at the time of birth, while the lowest percentage of unmarried women with births belong to 35 to 50 years age bracket with 15.8% of them unmarried.
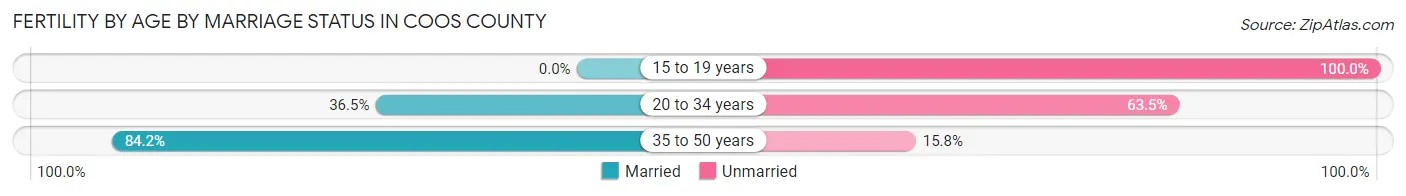
| Age Bracket | Married | Unmarried |
| 15 to 19 years | 0 (0.0%) | 3 (100.0%) |
| 20 to 34 years | 93 (36.5%) | 162 (63.5%) |
| 35 to 50 years | 16 (84.2%) | 3 (15.8%) |
| Total | 109 (39.4%) | 168 (60.7%) |
Fertility by Education in Coos County
Average fertility rate in Coos County is 52.0 births per 1,000 women. Women with the education attainment of college or associate's degree have the highest fertility rate of 104.0 births per 1,000 women, while women with the education attainment of bachelor's degree have the lowest fertility at 4.0 births per 1,000 women. Women with the education attainment of college or associate's degree represent 68.2% of all women with births.
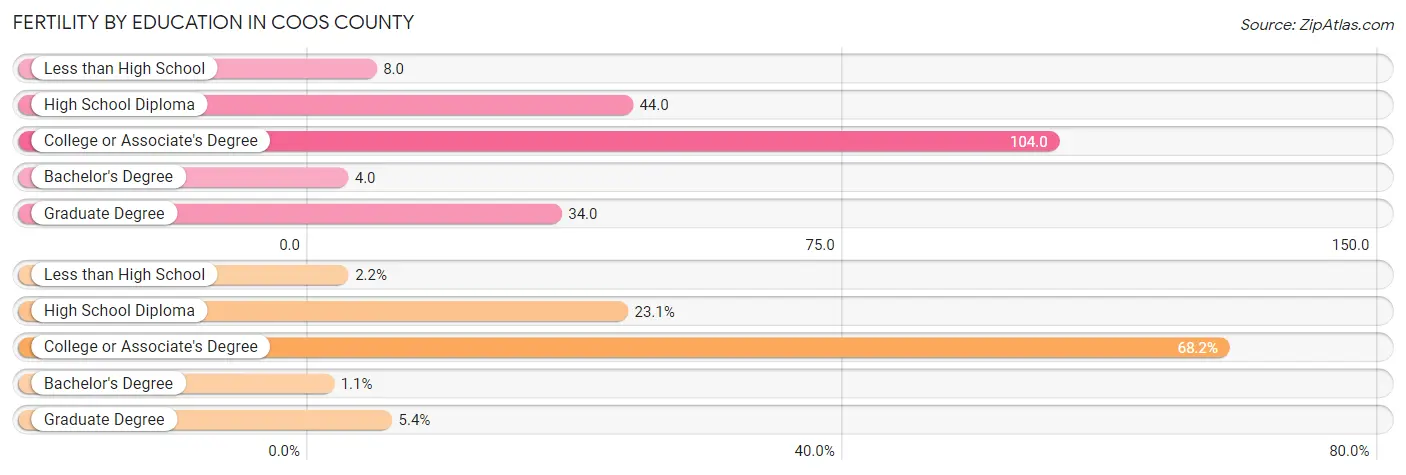
| Educational Attainment | Women with Births | Births / 1,000 Women |
| Less than High School | 6 (2.2%) | 8.0 |
| High School Diploma | 64 (23.1%) | 44.0 |
| College or Associate's Degree | 189 (68.2%) | 104.0 |
| Bachelor's Degree | 3 (1.1%) | 4.0 |
| Graduate Degree | 15 (5.4%) | 34.0 |
| Total | 277 (100.0%) | 52.0 |
Fertility by Education by Marriage Status in Coos County
60.7% of women with births in Coos County are unmarried. Women with the educational attainment of bachelor's degree are most likely to be married with 100.0% of them married at childbirth, while women with the educational attainment of less than high school are least likely to be married with 100.0% of them unmarried at childbirth.
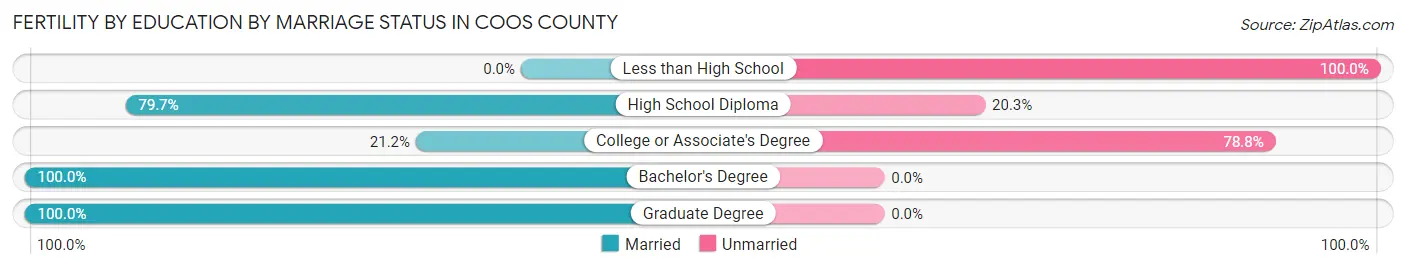
| Educational Attainment | Married | Unmarried |
| Less than High School | 0 (0.0%) | 6 (100.0%) |
| High School Diploma | 51 (79.7%) | 13 (20.3%) |
| College or Associate's Degree | 40 (21.2%) | 149 (78.8%) |
| Bachelor's Degree | 3 (100.0%) | 0 (0.0%) |
| Graduate Degree | 15 (100.0%) | 0 (0.0%) |
| Total | 109 (39.4%) | 168 (60.7%) |
Employment Characteristics in Coos County
Employment by Class of Employer in Coos County
Among the 14,066 employed individuals in Coos County, private company employees (7,796 | 55.4%), not-for-profit organizations (1,787 | 12.7%), and self-employed (not incorporated) (1,604 | 11.4%) make up the most common classes of employment.
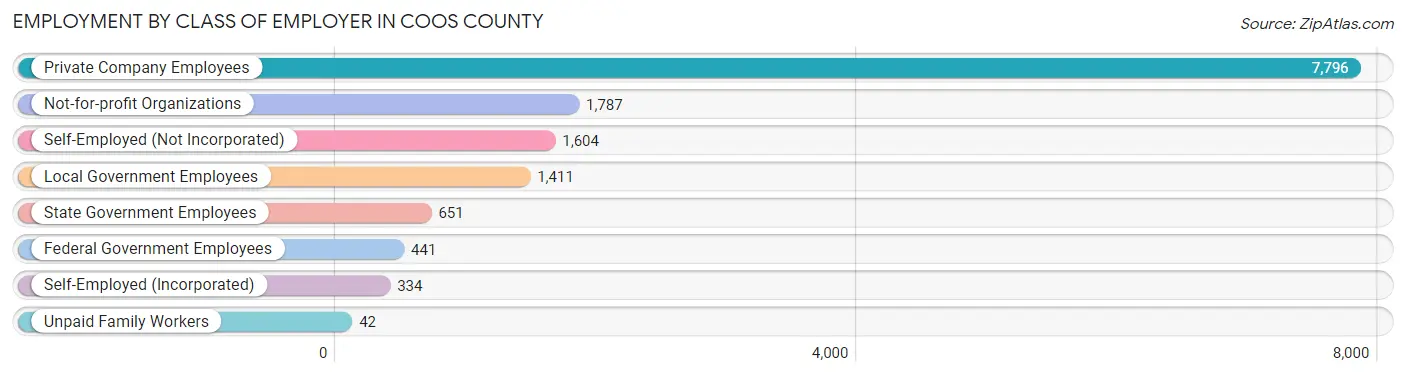
| Employer Class | # Employees | % Employees |
| Private Company Employees | 7,796 | 55.4% |
| Self-Employed (Incorporated) | 334 | 2.4% |
| Self-Employed (Not Incorporated) | 1,604 | 11.4% |
| Not-for-profit Organizations | 1,787 | 12.7% |
| Local Government Employees | 1,411 | 10.0% |
| State Government Employees | 651 | 4.6% |
| Federal Government Employees | 441 | 3.1% |
| Unpaid Family Workers | 42 | 0.3% |
| Total | 14,066 | 100.0% |
Employment Status by Age in Coos County
According to the labor force statistics for Coos County, out of the total population over 16 years of age (27,177), 55.5% or 15,083 individuals are in the labor force, with 4.2% or 633 of them unemployed. The age group with the highest labor force participation rate is 20 to 24 years, with 80.4% or 1,204 individuals in the labor force. Within the labor force, the 16 to 19 years age range has the highest percentage of unemployed individuals, with 17.4% or 122 of them being unemployed.
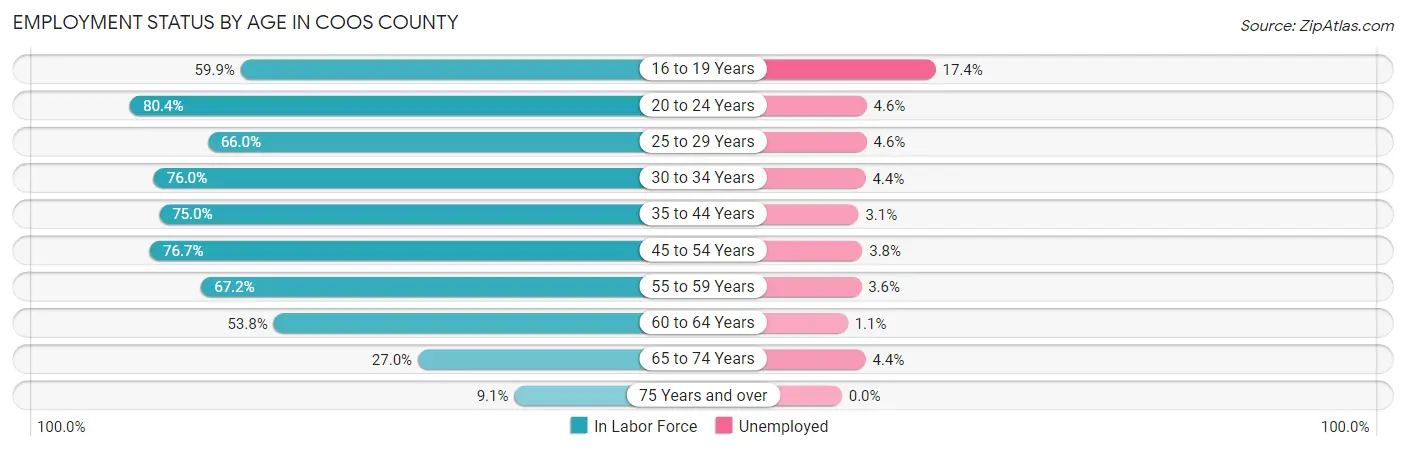
| Age Bracket | In Labor Force | Unemployed |
| 16 to 19 Years | 700 (59.9%) | 122 (17.4%) |
| 20 to 24 Years | 1,204 (80.4%) | 55 (4.6%) |
| 25 to 29 Years | 1,154 (66.0%) | 53 (4.6%) |
| 30 to 34 Years | 1,296 (76.0%) | 57 (4.4%) |
| 35 to 44 Years | 2,648 (75.0%) | 82 (3.1%) |
| 45 to 54 Years | 3,211 (76.7%) | 122 (3.8%) |
| 55 to 59 Years | 1,800 (67.2%) | 65 (3.6%) |
| 60 to 64 Years | 1,518 (53.8%) | 17 (1.1%) |
| 65 to 74 Years | 1,251 (27.0%) | 55 (4.4%) |
| 75 Years and over | 292 (9.1%) | 0 (0.0%) |
| Total | 15,083 (55.5%) | 633 (4.2%) |
Employment Status by Educational Attainment in Coos County
According to labor force statistics for Coos County, 69.7% of individuals (11,620) out of the total population between 25 and 64 years of age (16,671) are in the labor force, with 3.4% or 395 of them being unemployed. The group with the highest labor force participation rate are those with the educational attainment of bachelor's degree or higher, with 84.3% or 2,749 individuals in the labor force. Within the labor force, individuals with less than high school education have the highest percentage of unemployment, with 6.4% or 40 of them being unemployed.
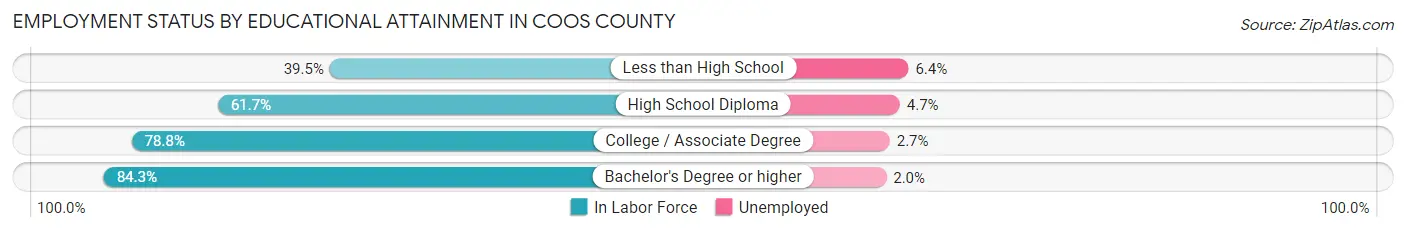
| Educational Attainment | In Labor Force | Unemployed |
| Less than High School | 627 (39.5%) | 102 (6.4%) |
| High School Diploma | 3,851 (61.7%) | 293 (4.7%) |
| College / Associate Degree | 4,399 (78.8%) | 151 (2.7%) |
| Bachelor's Degree or higher | 2,749 (84.3%) | 65 (2.0%) |
| Total | 11,620 (69.7%) | 567 (3.4%) |
Employment Occupations by Sex in Coos County
Management, Business, Science and Arts Occupations
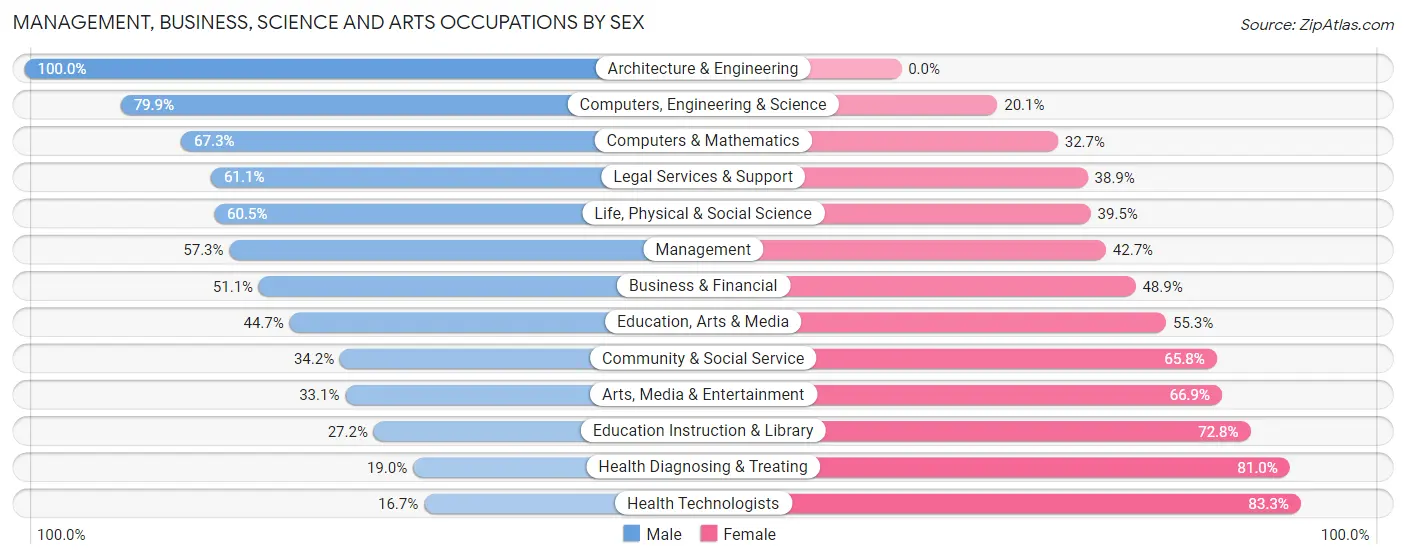
The most common Management, Business, Science and Arts occupations in Coos County are Community & Social Service (1,526 | 10.6%), Management (1,173 | 8.1%), Health Diagnosing & Treating (959 | 6.7%), Education Instruction & Library (876 | 6.1%), and Health Technologists (612 | 4.2%).
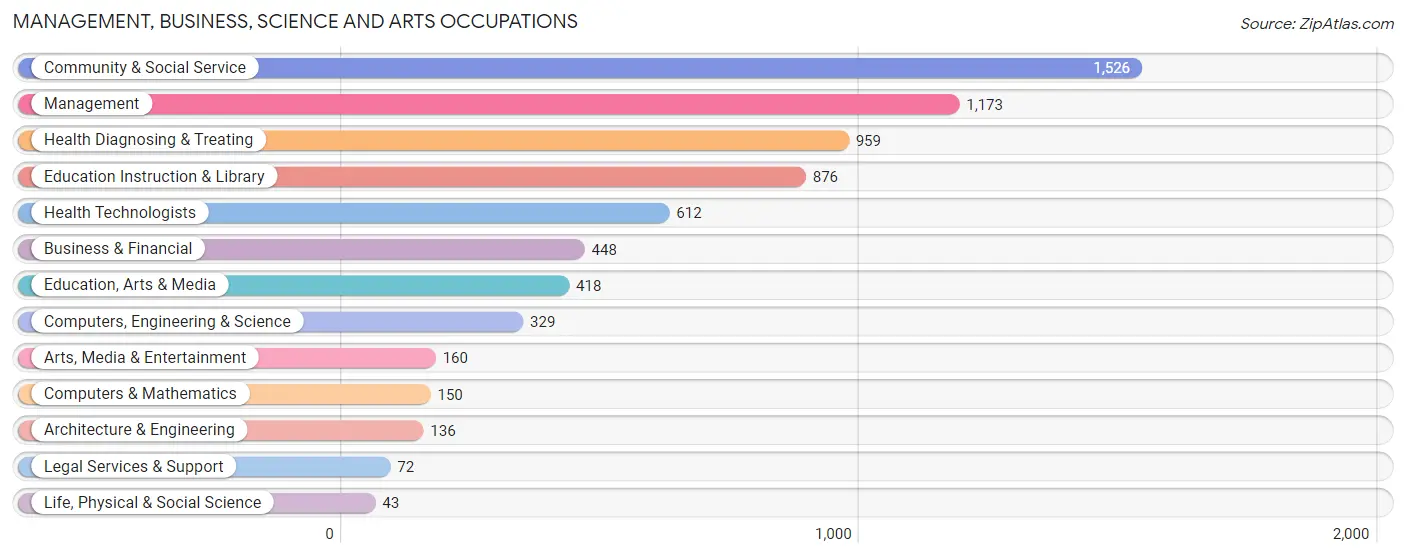
Management, Business, Science and Arts Occupations by Sex
Within the Management, Business, Science and Arts occupations in Coos County, the most male-oriented occupations are Architecture & Engineering (100.0%), Computers, Engineering & Science (79.9%), and Computers & Mathematics (67.3%), while the most female-oriented occupations are Health Technologists (83.3%), Health Diagnosing & Treating (81.0%), and Education Instruction & Library (72.8%).
| Occupation | Male | Female |
| Management | 672 (57.3%) | 501 (42.7%) |
| Business & Financial | 229 (51.1%) | 219 (48.9%) |
| Computers, Engineering & Science | 263 (79.9%) | 66 (20.1%) |
| Computers & Mathematics | 101 (67.3%) | 49 (32.7%) |
| Architecture & Engineering | 136 (100.0%) | 0 (0.0%) |
| Life, Physical & Social Science | 26 (60.5%) | 17 (39.5%) |
| Community & Social Service | 522 (34.2%) | 1,004 (65.8%) |
| Education, Arts & Media | 187 (44.7%) | 231 (55.3%) |
| Legal Services & Support | 44 (61.1%) | 28 (38.9%) |
| Education Instruction & Library | 238 (27.2%) | 638 (72.8%) |
| Arts, Media & Entertainment | 53 (33.1%) | 107 (66.9%) |
| Health Diagnosing & Treating | 182 (19.0%) | 777 (81.0%) |
| Health Technologists | 102 (16.7%) | 510 (83.3%) |
| Total (Category) | 1,868 (42.1%) | 2,567 (57.9%) |
| Total (Overall) | 7,559 (52.4%) | 6,872 (47.6%) |
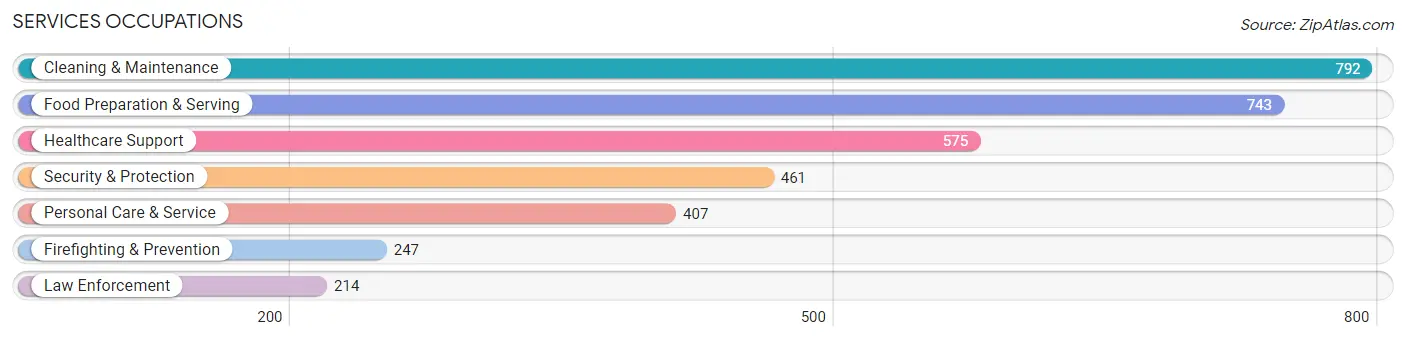
Services Occupations
The most common Services occupations in Coos County are Cleaning & Maintenance (792 | 5.5%), Food Preparation & Serving (743 | 5.1%), Healthcare Support (575 | 4.0%), Security & Protection (461 | 3.2%), and Personal Care & Service (407 | 2.8%).
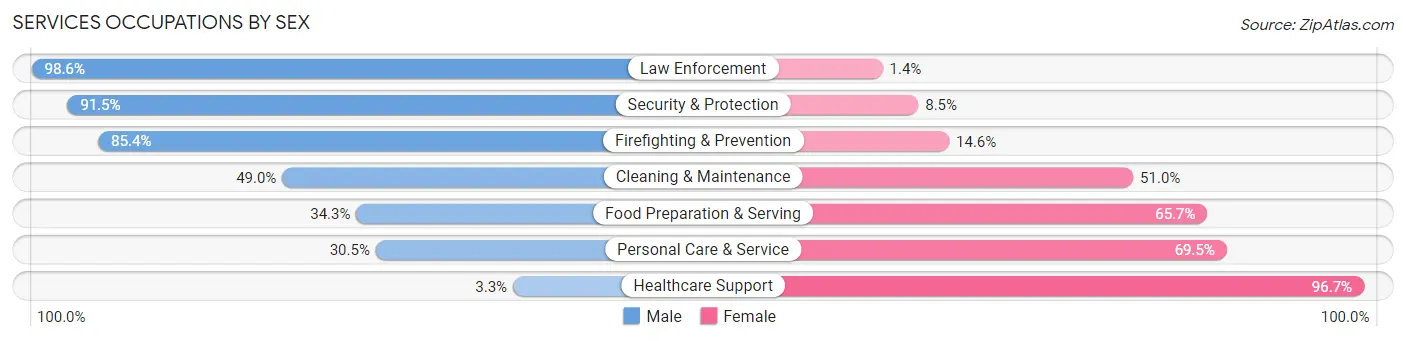
Services Occupations by Sex
Within the Services occupations in Coos County, the most male-oriented occupations are Law Enforcement (98.6%), Security & Protection (91.5%), and Firefighting & Prevention (85.4%), while the most female-oriented occupations are Healthcare Support (96.7%), Personal Care & Service (69.5%), and Food Preparation & Serving (65.7%).
| Occupation | Male | Female |
| Healthcare Support | 19 (3.3%) | 556 (96.7%) |
| Security & Protection | 422 (91.5%) | 39 (8.5%) |
| Firefighting & Prevention | 211 (85.4%) | 36 (14.6%) |
| Law Enforcement | 211 (98.6%) | 3 (1.4%) |
| Food Preparation & Serving | 255 (34.3%) | 488 (65.7%) |
| Cleaning & Maintenance | 388 (49.0%) | 404 (51.0%) |
| Personal Care & Service | 124 (30.5%) | 283 (69.5%) |
| Total (Category) | 1,208 (40.6%) | 1,770 (59.4%) |
| Total (Overall) | 7,559 (52.4%) | 6,872 (47.6%) |
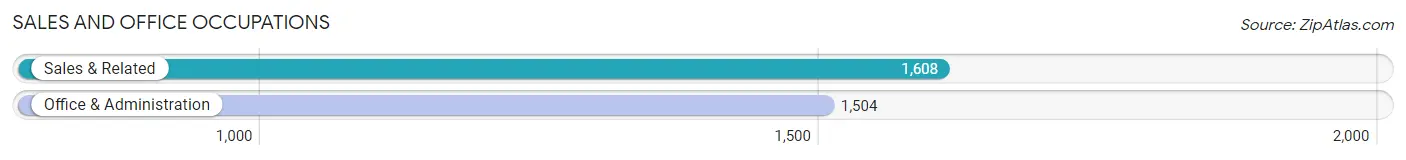
Sales and Office Occupations
The most common Sales and Office occupations in Coos County are Sales & Related (1,608 | 11.1%), and Office & Administration (1,504 | 10.4%).
Sales and Office Occupations by Sex
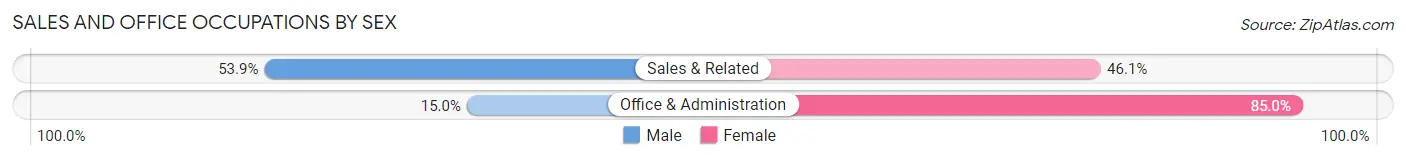
| Occupation | Male | Female |
| Sales & Related | 867 (53.9%) | 741 (46.1%) |
| Office & Administration | 225 (15.0%) | 1,279 (85.0%) |
| Total (Category) | 1,092 (35.1%) | 2,020 (64.9%) |
| Total (Overall) | 7,559 (52.4%) | 6,872 (47.6%) |
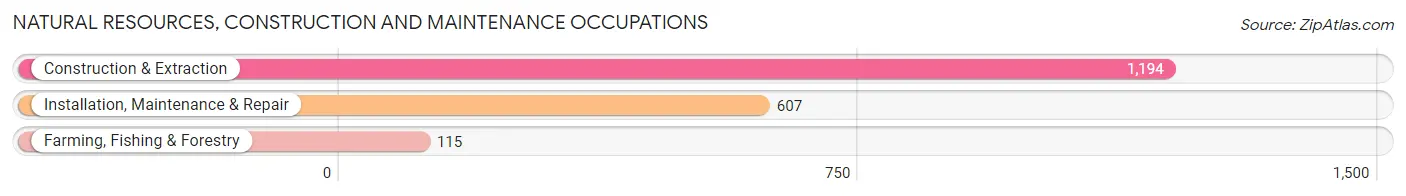
Natural Resources, Construction and Maintenance Occupations
The most common Natural Resources, Construction and Maintenance occupations in Coos County are Construction & Extraction (1,194 | 8.3%), Installation, Maintenance & Repair (607 | 4.2%), and Farming, Fishing & Forestry (115 | 0.8%).
Natural Resources, Construction and Maintenance Occupations by Sex
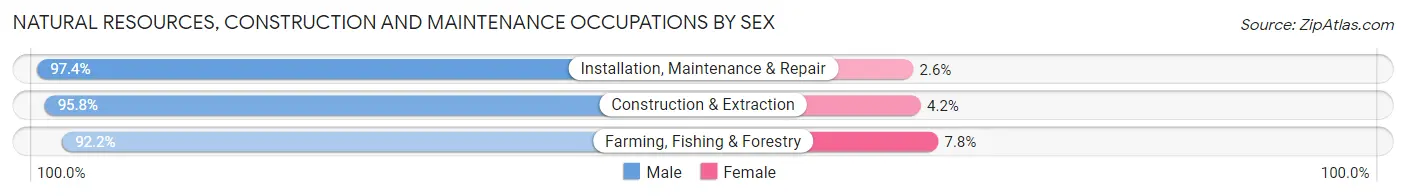
| Occupation | Male | Female |
| Farming, Fishing & Forestry | 106 (92.2%) | 9 (7.8%) |
| Construction & Extraction | 1,144 (95.8%) | 50 (4.2%) |
| Installation, Maintenance & Repair | 591 (97.4%) | 16 (2.6%) |
| Total (Category) | 1,841 (96.1%) | 75 (3.9%) |
| Total (Overall) | 7,559 (52.4%) | 6,872 (47.6%) |
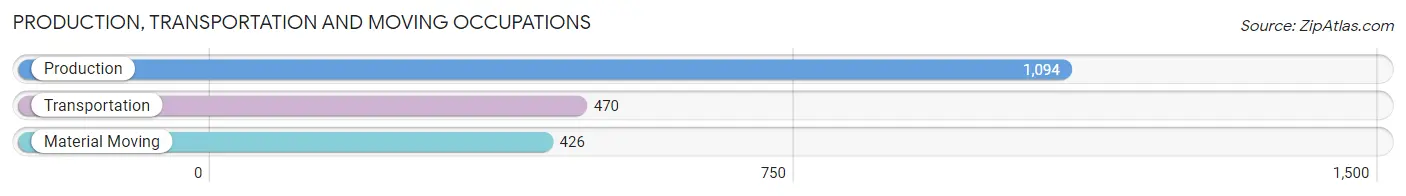
Production, Transportation and Moving Occupations
The most common Production, Transportation and Moving occupations in Coos County are Production (1,094 | 7.6%), Transportation (470 | 3.3%), and Material Moving (426 | 2.9%).
Production, Transportation and Moving Occupations by Sex
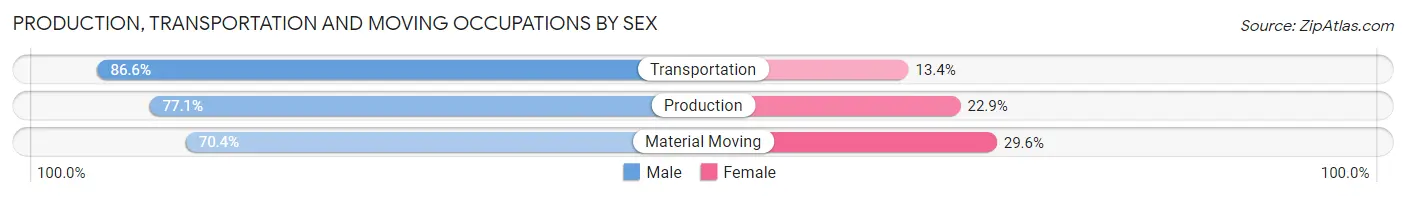
| Occupation | Male | Female |
| Production | 843 (77.1%) | 251 (22.9%) |
| Transportation | 407 (86.6%) | 63 (13.4%) |
| Material Moving | 300 (70.4%) | 126 (29.6%) |
| Total (Category) | 1,550 (77.9%) | 440 (22.1%) |
| Total (Overall) | 7,559 (52.4%) | 6,872 (47.6%) |
Employment Industries by Sex in Coos County
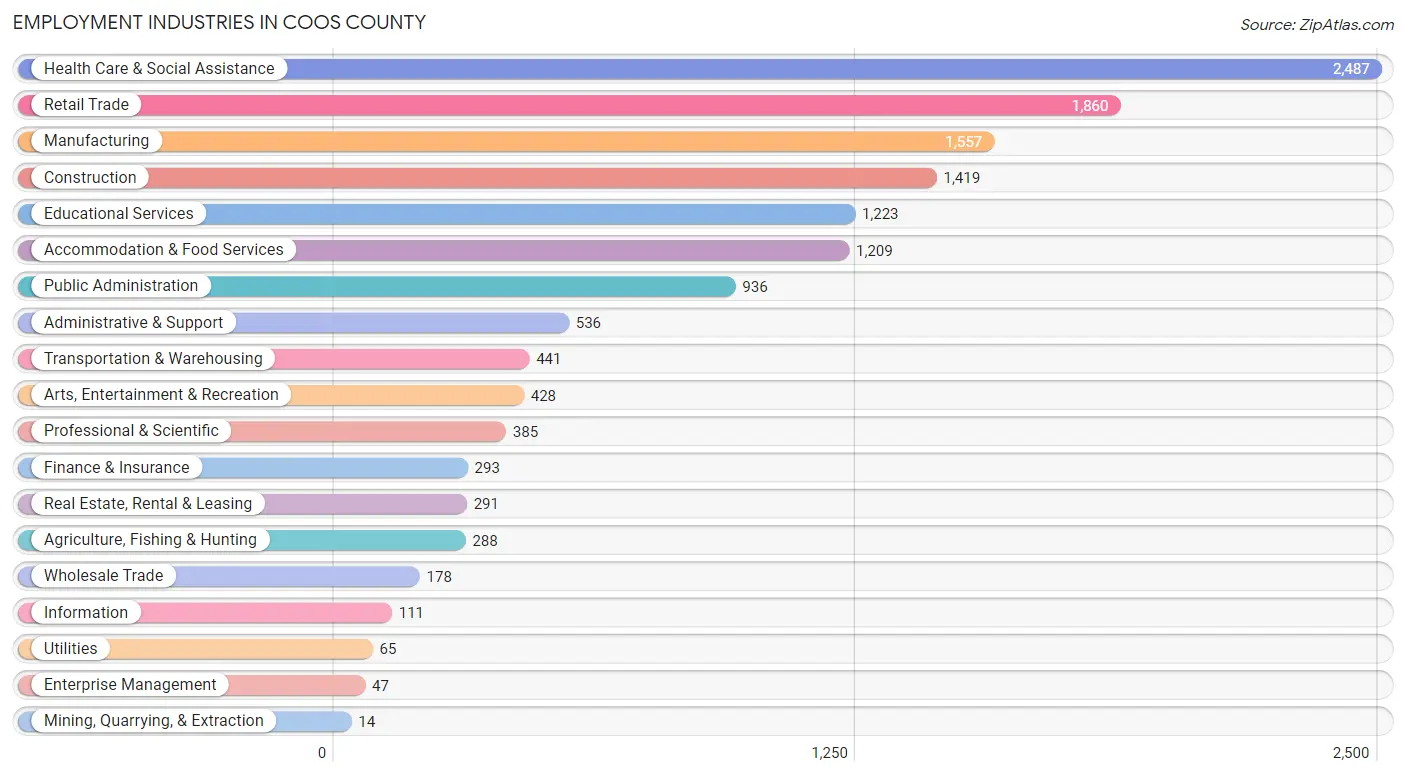
Employment Industries in Coos County
The major employment industries in Coos County include Health Care & Social Assistance (2,487 | 17.2%), Retail Trade (1,860 | 12.9%), Manufacturing (1,557 | 10.8%), Construction (1,419 | 9.8%), and Educational Services (1,223 | 8.5%).
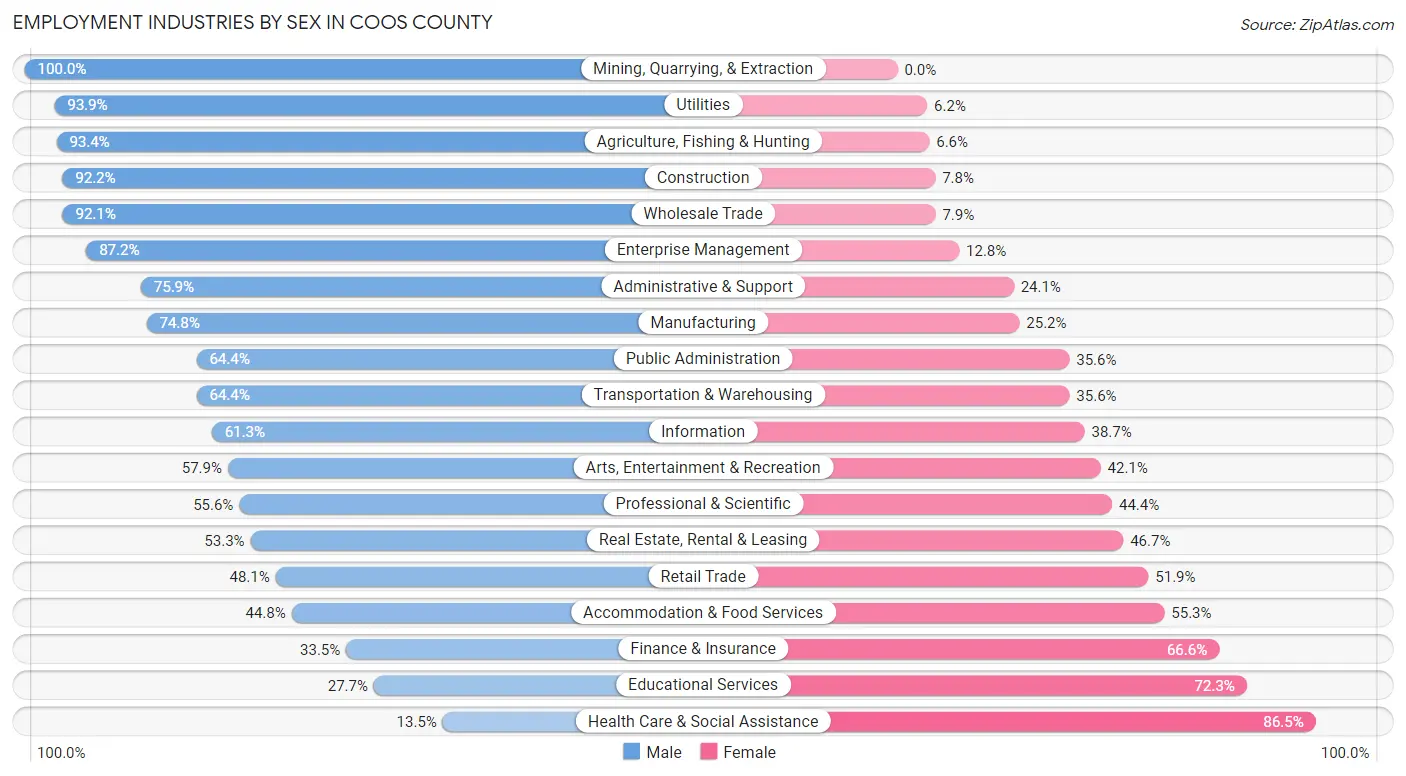
Employment Industries by Sex in Coos County
The Coos County industries that see more men than women are Mining, Quarrying, & Extraction (100.0%), Utilities (93.9%), and Agriculture, Fishing & Hunting (93.4%), whereas the industries that tend to have a higher number of women are Health Care & Social Assistance (86.5%), Educational Services (72.3%), and Finance & Insurance (66.5%).
| Industry | Male | Female |
| Agriculture, Fishing & Hunting | 269 (93.4%) | 19 (6.6%) |
| Mining, Quarrying, & Extraction | 14 (100.0%) | 0 (0.0%) |
| Construction | 1,308 (92.2%) | 111 (7.8%) |
| Manufacturing | 1,164 (74.8%) | 393 (25.2%) |
| Wholesale Trade | 164 (92.1%) | 14 (7.9%) |
| Retail Trade | 894 (48.1%) | 966 (51.9%) |
| Transportation & Warehousing | 284 (64.4%) | 157 (35.6%) |
| Utilities | 61 (93.9%) | 4 (6.1%) |
| Information | 68 (61.3%) | 43 (38.7%) |
| Finance & Insurance | 98 (33.5%) | 195 (66.5%) |
| Real Estate, Rental & Leasing | 155 (53.3%) | 136 (46.7%) |
| Professional & Scientific | 214 (55.6%) | 171 (44.4%) |
| Enterprise Management | 41 (87.2%) | 6 (12.8%) |
| Administrative & Support | 407 (75.9%) | 129 (24.1%) |
| Educational Services | 339 (27.7%) | 884 (72.3%) |
| Health Care & Social Assistance | 335 (13.5%) | 2,152 (86.5%) |
| Arts, Entertainment & Recreation | 248 (57.9%) | 180 (42.1%) |
| Accommodation & Food Services | 541 (44.8%) | 668 (55.2%) |
| Public Administration | 603 (64.4%) | 333 (35.6%) |
| Total | 7,559 (52.4%) | 6,872 (47.6%) |
Education in Coos County
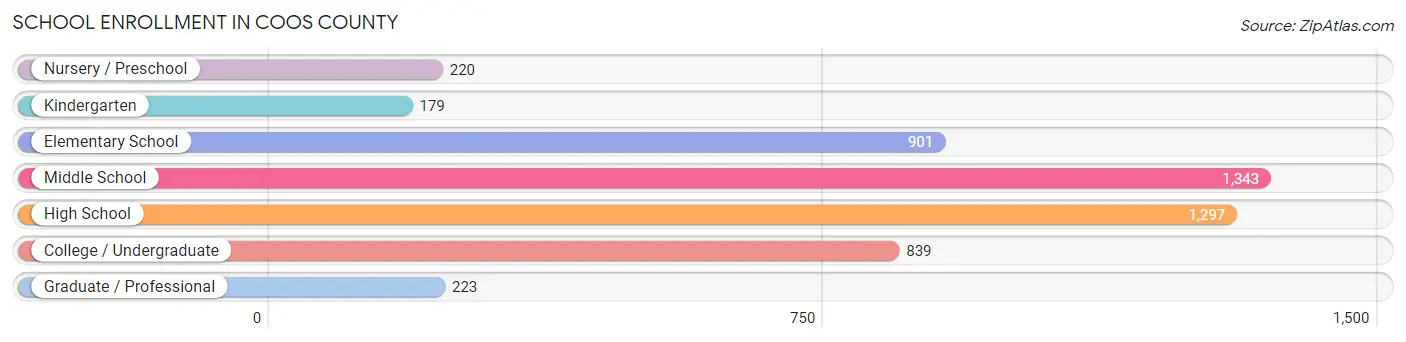
School Enrollment in Coos County
The most common levels of schooling among the 5,002 students in Coos County are middle school (1,343 | 26.9%), high school (1,297 | 25.9%), and elementary school (901 | 18.0%).
| School Level | # Students | % Students |
| Nursery / Preschool | 220 | 4.4% |
| Kindergarten | 179 | 3.6% |
| Elementary School | 901 | 18.0% |
| Middle School | 1,343 | 26.9% |
| High School | 1,297 | 25.9% |
| College / Undergraduate | 839 | 16.8% |
| Graduate / Professional | 223 | 4.5% |
| Total | 5,002 | 100.0% |
School Enrollment by Age by Funding Source in Coos County
Out of a total of 5,002 students who are enrolled in schools in Coos County, 645 (12.9%) attend a private institution, while the remaining 4,357 (87.1%) are enrolled in public schools. The age group of 3 to 4 year olds has the highest likelihood of being enrolled in private schools, with 56 (32.8% in the age bracket) enrolled. Conversely, the age group of 15 to 17 year olds has the lowest likelihood of being enrolled in a private school, with 945 (98.4% in the age bracket) attending a public institution.
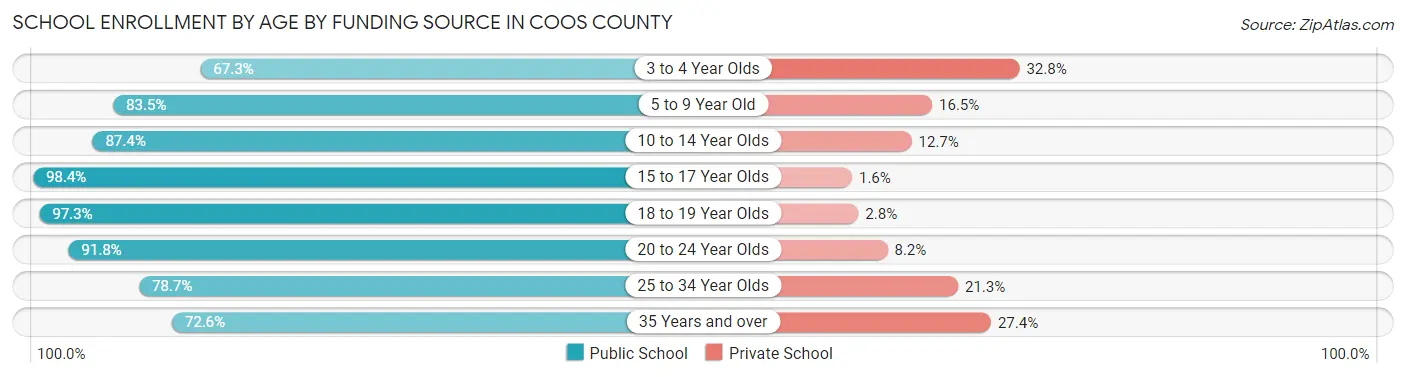
| Age Bracket | Public School | Private School |
| 3 to 4 Year Olds | 115 (67.2%) | 56 (32.8%) |
| 5 to 9 Year Old | 857 (83.5%) | 169 (16.5%) |
| 10 to 14 Year Olds | 1,353 (87.4%) | 196 (12.7%) |
| 15 to 17 Year Olds | 945 (98.4%) | 15 (1.6%) |
| 18 to 19 Year Olds | 248 (97.3%) | 7 (2.8%) |
| 20 to 24 Year Olds | 337 (91.8%) | 30 (8.2%) |
| 25 to 34 Year Olds | 192 (78.7%) | 52 (21.3%) |
| 35 Years and over | 312 (72.6%) | 118 (27.4%) |
| Total | 4,357 (87.1%) | 645 (12.9%) |
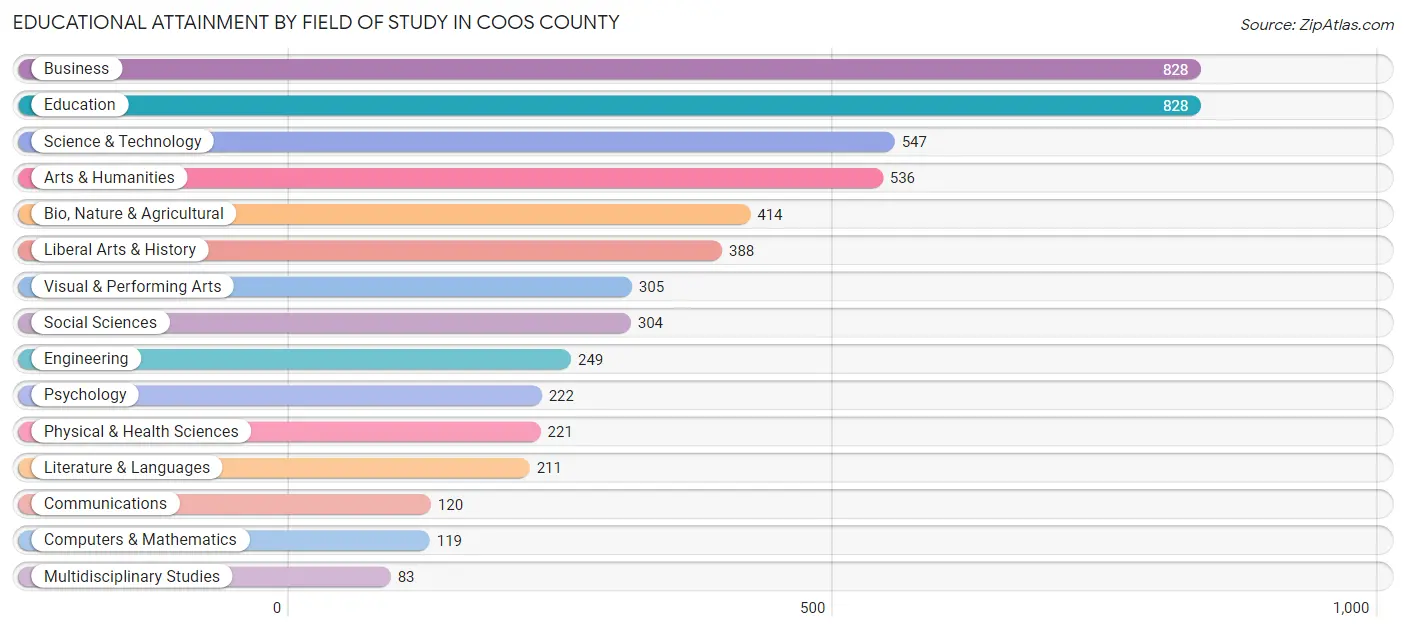
Educational Attainment by Field of Study in Coos County
Business (828 | 15.4%), education (828 | 15.4%), science & technology (547 | 10.2%), arts & humanities (536 | 10.0%), and bio, nature & agricultural (414 | 7.7%) are the most common fields of study among 5,375 individuals in Coos County who have obtained a bachelor's degree or higher.
| Field of Study | # Graduates | % Graduates |
| Computers & Mathematics | 119 | 2.2% |
| Bio, Nature & Agricultural | 414 | 7.7% |
| Physical & Health Sciences | 221 | 4.1% |
| Psychology | 222 | 4.1% |
| Social Sciences | 304 | 5.7% |
| Engineering | 249 | 4.6% |
| Multidisciplinary Studies | 83 | 1.5% |
| Science & Technology | 547 | 10.2% |
| Business | 828 | 15.4% |
| Education | 828 | 15.4% |
| Literature & Languages | 211 | 3.9% |
| Liberal Arts & History | 388 | 7.2% |
| Visual & Performing Arts | 305 | 5.7% |
| Communications | 120 | 2.2% |
| Arts & Humanities | 536 | 10.0% |
| Total | 5,375 | 100.0% |
Transportation & Commute in Coos County
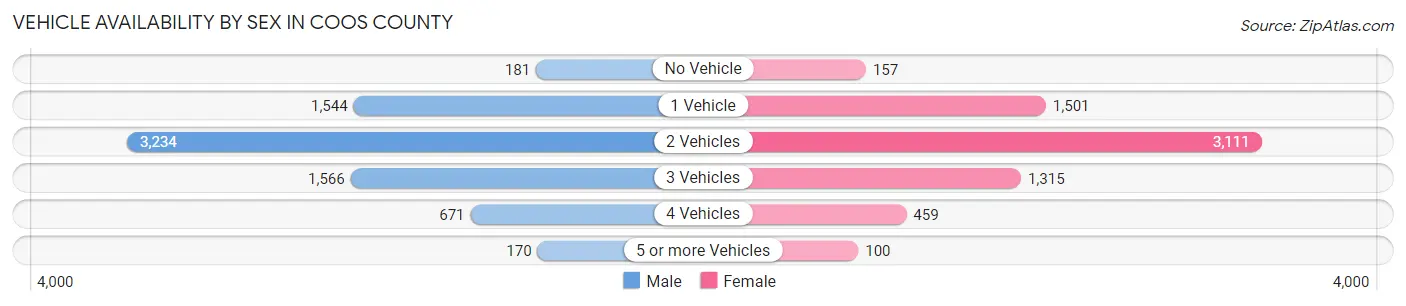
Vehicle Availability by Sex in Coos County
The most prevalent vehicle ownership categories in Coos County are males with 2 vehicles (3,234, accounting for 43.9%) and females with 2 vehicles (3,111, making up 48.7%).
| Vehicles Available | Male | Female |
| No Vehicle | 181 (2.5%) | 157 (2.4%) |
| 1 Vehicle | 1,544 (21.0%) | 1,501 (22.6%) |
| 2 Vehicles | 3,234 (43.9%) | 3,111 (46.8%) |
| 3 Vehicles | 1,566 (21.3%) | 1,315 (19.8%) |
| 4 Vehicles | 671 (9.1%) | 459 (6.9%) |
| 5 or more Vehicles | 170 (2.3%) | 100 (1.5%) |
| Total | 7,366 (100.0%) | 6,643 (100.0%) |
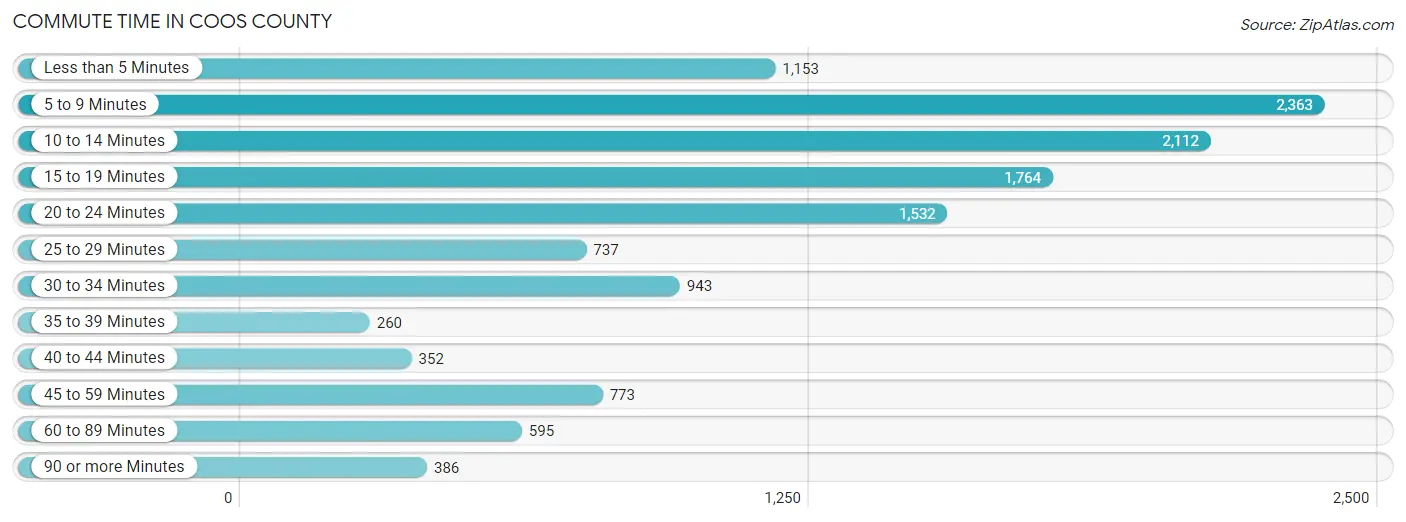
Commute Time in Coos County
The most frequently occuring commute durations in Coos County are 5 to 9 minutes (2,363 commuters, 18.2%), 10 to 14 minutes (2,112 commuters, 16.3%), and 15 to 19 minutes (1,764 commuters, 13.6%).
| Commute Time | # Commuters | % Commuters |
| Less than 5 Minutes | 1,153 | 8.9% |
| 5 to 9 Minutes | 2,363 | 18.2% |
| 10 to 14 Minutes | 2,112 | 16.3% |
| 15 to 19 Minutes | 1,764 | 13.6% |
| 20 to 24 Minutes | 1,532 | 11.8% |
| 25 to 29 Minutes | 737 | 5.7% |
| 30 to 34 Minutes | 943 | 7.3% |
| 35 to 39 Minutes | 260 | 2.0% |
| 40 to 44 Minutes | 352 | 2.7% |
| 45 to 59 Minutes | 773 | 6.0% |
| 60 to 89 Minutes | 595 | 4.6% |
| 90 or more Minutes | 386 | 3.0% |
Commute Time by Sex in Coos County
The most common commute times in Coos County are 10 to 14 minutes (1,236 commuters, 18.1%) for males and 5 to 9 minutes (1,364 commuters, 22.2%) for females.
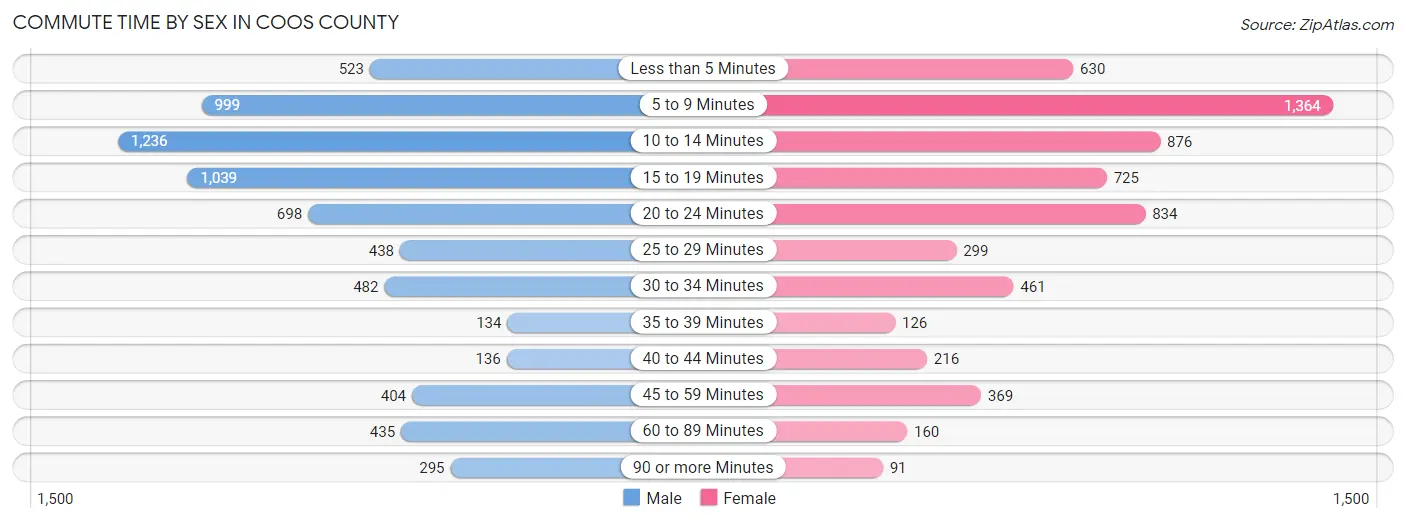
| Commute Time | Male | Female |
| Less than 5 Minutes | 523 (7.7%) | 630 (10.2%) |
| 5 to 9 Minutes | 999 (14.6%) | 1,364 (22.2%) |
| 10 to 14 Minutes | 1,236 (18.1%) | 876 (14.2%) |
| 15 to 19 Minutes | 1,039 (15.2%) | 725 (11.8%) |
| 20 to 24 Minutes | 698 (10.2%) | 834 (13.6%) |
| 25 to 29 Minutes | 438 (6.4%) | 299 (4.9%) |
| 30 to 34 Minutes | 482 (7.1%) | 461 (7.5%) |
| 35 to 39 Minutes | 134 (2.0%) | 126 (2.1%) |
| 40 to 44 Minutes | 136 (2.0%) | 216 (3.5%) |
| 45 to 59 Minutes | 404 (5.9%) | 369 (6.0%) |
| 60 to 89 Minutes | 435 (6.4%) | 160 (2.6%) |
| 90 or more Minutes | 295 (4.3%) | 91 (1.5%) |
Time of Departure to Work by Sex in Coos County
The most frequent times of departure to work in Coos County are 7:00 AM to 7:29 AM (918, 13.5%) for males and 7:30 AM to 7:59 AM (1,118, 18.2%) for females.
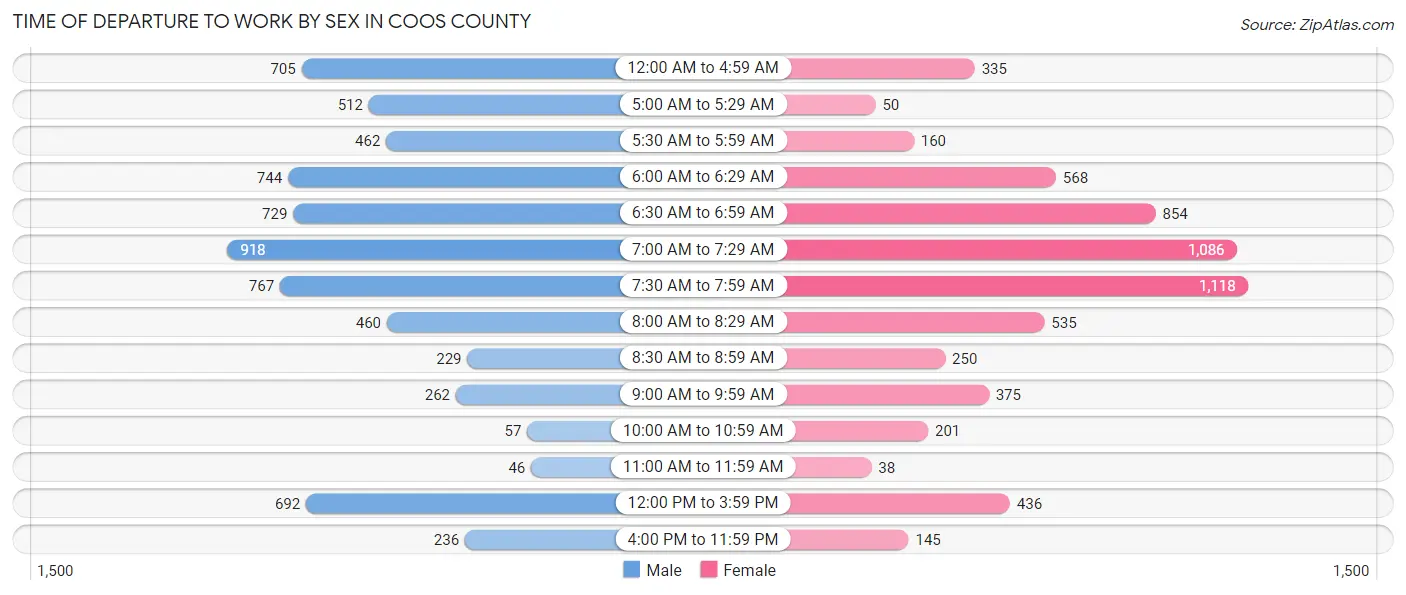
| Time of Departure | Male | Female |
| 12:00 AM to 4:59 AM | 705 (10.3%) | 335 (5.4%) |
| 5:00 AM to 5:29 AM | 512 (7.5%) | 50 (0.8%) |
| 5:30 AM to 5:59 AM | 462 (6.8%) | 160 (2.6%) |
| 6:00 AM to 6:29 AM | 744 (10.9%) | 568 (9.2%) |
| 6:30 AM to 6:59 AM | 729 (10.7%) | 854 (13.9%) |
| 7:00 AM to 7:29 AM | 918 (13.5%) | 1,086 (17.7%) |
| 7:30 AM to 7:59 AM | 767 (11.3%) | 1,118 (18.2%) |
| 8:00 AM to 8:29 AM | 460 (6.8%) | 535 (8.7%) |
| 8:30 AM to 8:59 AM | 229 (3.4%) | 250 (4.1%) |
| 9:00 AM to 9:59 AM | 262 (3.8%) | 375 (6.1%) |
| 10:00 AM to 10:59 AM | 57 (0.8%) | 201 (3.3%) |
| 11:00 AM to 11:59 AM | 46 (0.7%) | 38 (0.6%) |
| 12:00 PM to 3:59 PM | 692 (10.2%) | 436 (7.1%) |
| 4:00 PM to 11:59 PM | 236 (3.5%) | 145 (2.4%) |
| Total | 6,819 (100.0%) | 6,151 (100.0%) |
Housing Occupancy in Coos County
Occupancy by Ownership in Coos County
Of the total 13,620 dwellings in Coos County, owner-occupied units account for 9,962 (73.1%), while renter-occupied units make up 3,658 (26.9%).
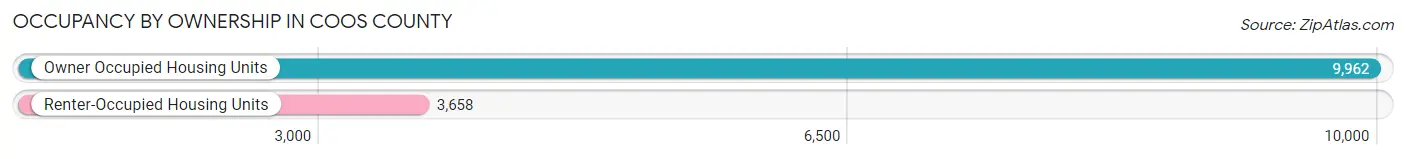
| Occupancy | # Housing Units | % Housing Units |
| Owner Occupied Housing Units | 9,962 | 73.1% |
| Renter-Occupied Housing Units | 3,658 | 26.9% |
| Total Occupied Housing Units | 13,620 | 100.0% |
Occupancy by Household Size in Coos County
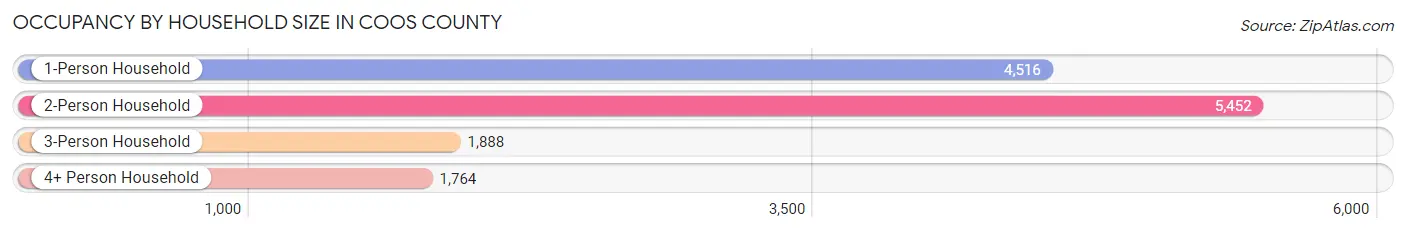
| Household Size | # Housing Units | % Housing Units |
| 1-Person Household | 4,516 | 33.2% |
| 2-Person Household | 5,452 | 40.0% |
| 3-Person Household | 1,888 | 13.9% |
| 4+ Person Household | 1,764 | 13.0% |
| Total Housing Units | 13,620 | 100.0% |
Occupancy by Ownership by Household Size in Coos County
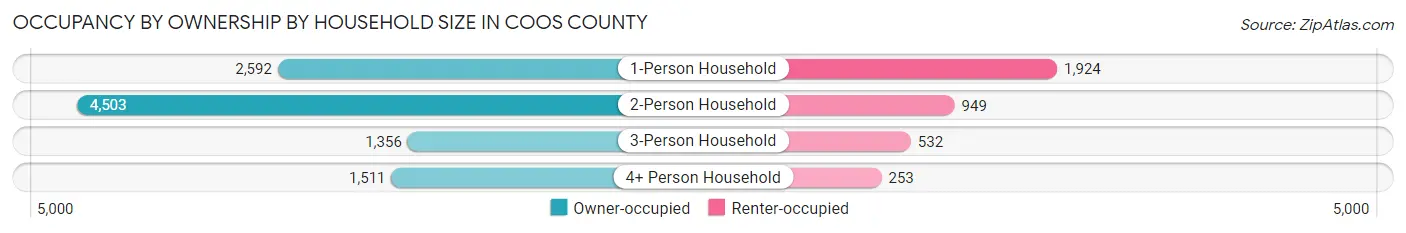
| Household Size | Owner-occupied | Renter-occupied |
| 1-Person Household | 2,592 (57.4%) | 1,924 (42.6%) |
| 2-Person Household | 4,503 (82.6%) | 949 (17.4%) |
| 3-Person Household | 1,356 (71.8%) | 532 (28.2%) |
| 4+ Person Household | 1,511 (85.7%) | 253 (14.3%) |
| Total Housing Units | 9,962 (73.1%) | 3,658 (26.9%) |
Occupancy by Educational Attainment in Coos County
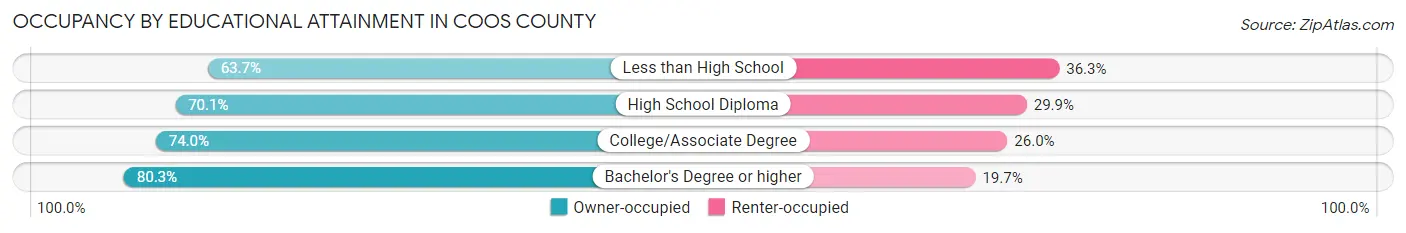
| Household Size | Owner-occupied | Renter-occupied |
| Less than High School | 821 (63.7%) | 468 (36.3%) |
| High School Diploma | 3,335 (70.1%) | 1,420 (29.9%) |
| College/Associate Degree | 3,253 (74.0%) | 1,144 (26.0%) |
| Bachelor's Degree or higher | 2,553 (80.3%) | 626 (19.7%) |
Occupancy by Age of Householder in Coos County
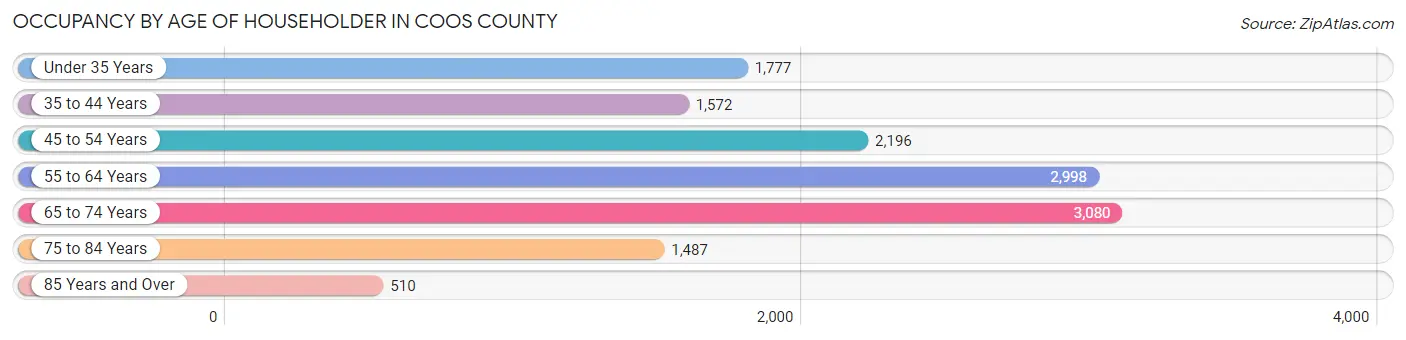
| Age Bracket | # Households | % Households |
| Under 35 Years | 1,777 | 13.1% |
| 35 to 44 Years | 1,572 | 11.5% |
| 45 to 54 Years | 2,196 | 16.1% |
| 55 to 64 Years | 2,998 | 22.0% |
| 65 to 74 Years | 3,080 | 22.6% |
| 75 to 84 Years | 1,487 | 10.9% |
| 85 Years and Over | 510 | 3.7% |
| Total | 13,620 | 100.0% |
Housing Finances in Coos County
Median Income by Occupancy in Coos County
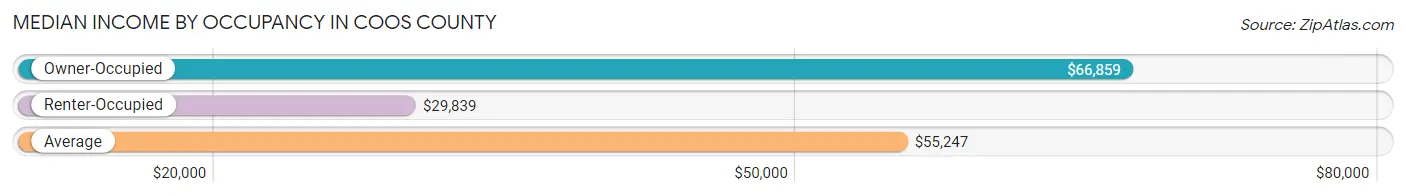
| Occupancy Type | # Households | Median Income |
| Owner-Occupied | 9,962 (73.1%) | $66,859 |
| Renter-Occupied | 3,658 (26.9%) | $29,839 |
| Average | 13,620 (100.0%) | $55,247 |
Occupancy by Householder Income Bracket in Coos County
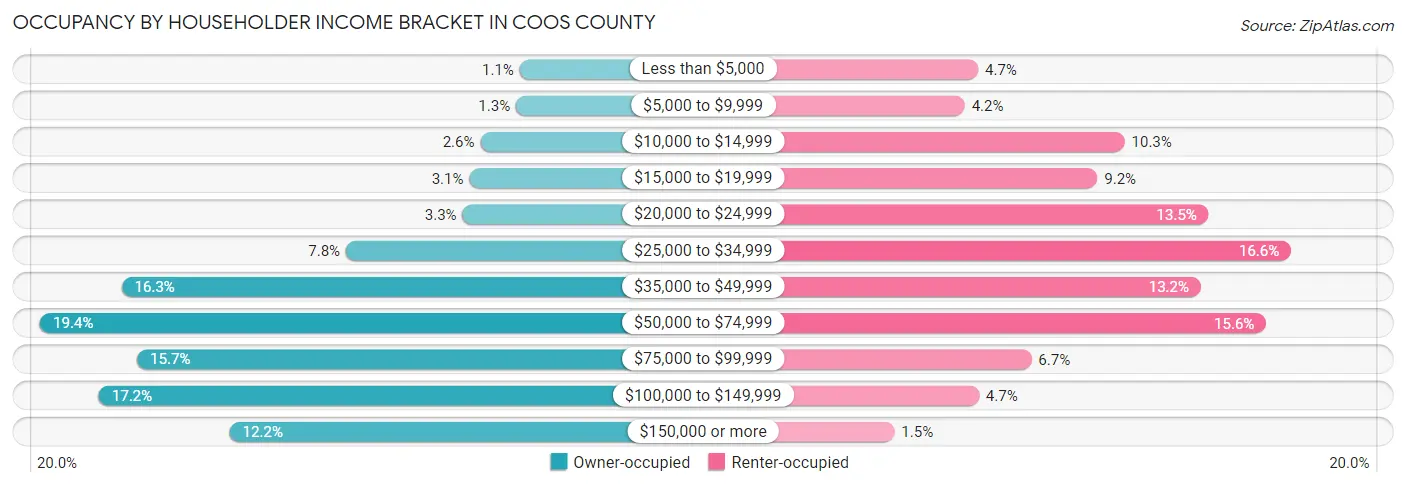
| Income Bracket | Owner-occupied | Renter-occupied |
| Less than $5,000 | 114 (1.1%) | 171 (4.7%) |
| $5,000 to $9,999 | 128 (1.3%) | 152 (4.2%) |
| $10,000 to $14,999 | 263 (2.6%) | 375 (10.2%) |
| $15,000 to $19,999 | 305 (3.1%) | 337 (9.2%) |
| $20,000 to $24,999 | 331 (3.3%) | 492 (13.5%) |
| $25,000 to $34,999 | 773 (7.8%) | 607 (16.6%) |
| $35,000 to $49,999 | 1,625 (16.3%) | 481 (13.2%) |
| $50,000 to $74,999 | 1,934 (19.4%) | 572 (15.6%) |
| $75,000 to $99,999 | 1,565 (15.7%) | 245 (6.7%) |
| $100,000 to $149,999 | 1,710 (17.2%) | 172 (4.7%) |
| $150,000 or more | 1,214 (12.2%) | 54 (1.5%) |
| Total | 9,962 (100.0%) | 3,658 (100.0%) |
Monthly Housing Cost Tiers in Coos County
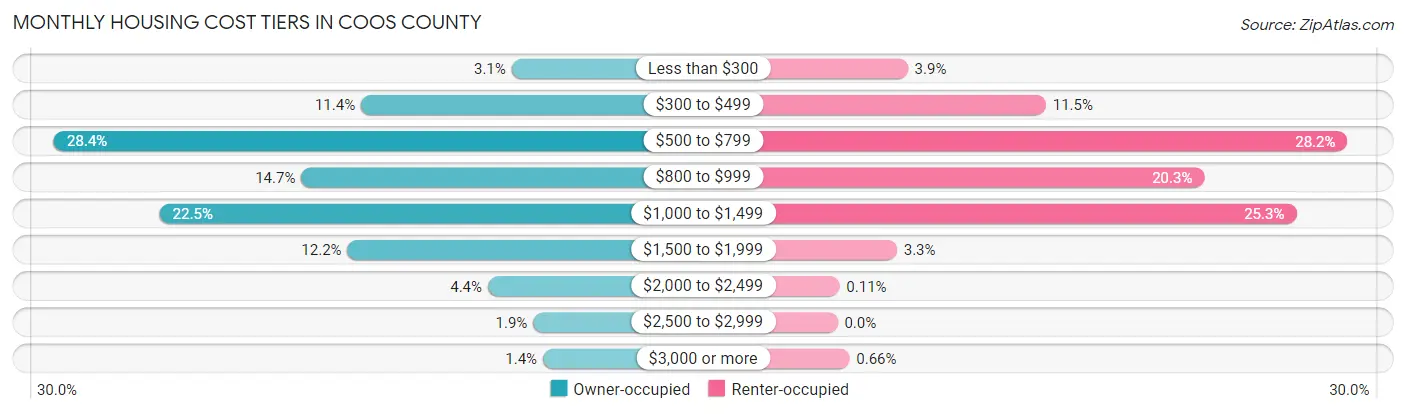
| Monthly Cost | Owner-occupied | Renter-occupied |
| Less than $300 | 309 (3.1%) | 142 (3.9%) |
| $300 to $499 | 1,138 (11.4%) | 421 (11.5%) |
| $500 to $799 | 2,827 (28.4%) | 1,030 (28.2%) |
| $800 to $999 | 1,466 (14.7%) | 741 (20.3%) |
| $1,000 to $1,499 | 2,245 (22.5%) | 927 (25.3%) |
| $1,500 to $1,999 | 1,212 (12.2%) | 120 (3.3%) |
| $2,000 to $2,499 | 439 (4.4%) | 4 (0.1%) |
| $2,500 to $2,999 | 190 (1.9%) | 0 (0.0%) |
| $3,000 or more | 136 (1.4%) | 24 (0.7%) |
| Total | 9,962 (100.0%) | 3,658 (100.0%) |
Physical Housing Characteristics in Coos County
Housing Structures in Coos County
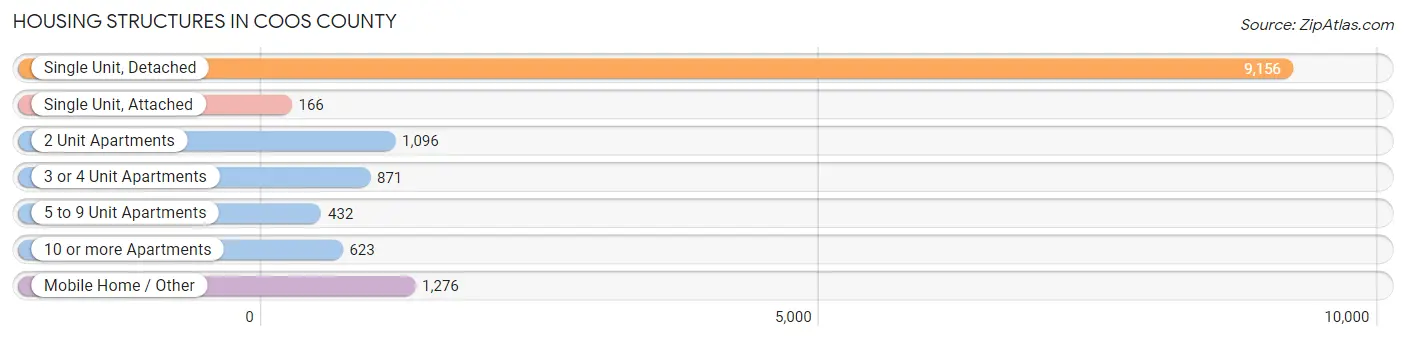
| Structure Type | # Housing Units | % Housing Units |
| Single Unit, Detached | 9,156 | 67.2% |
| Single Unit, Attached | 166 | 1.2% |
| 2 Unit Apartments | 1,096 | 8.1% |
| 3 or 4 Unit Apartments | 871 | 6.4% |
| 5 to 9 Unit Apartments | 432 | 3.2% |
| 10 or more Apartments | 623 | 4.6% |
| Mobile Home / Other | 1,276 | 9.4% |
| Total | 13,620 | 100.0% |
Housing Structures by Occupancy in Coos County
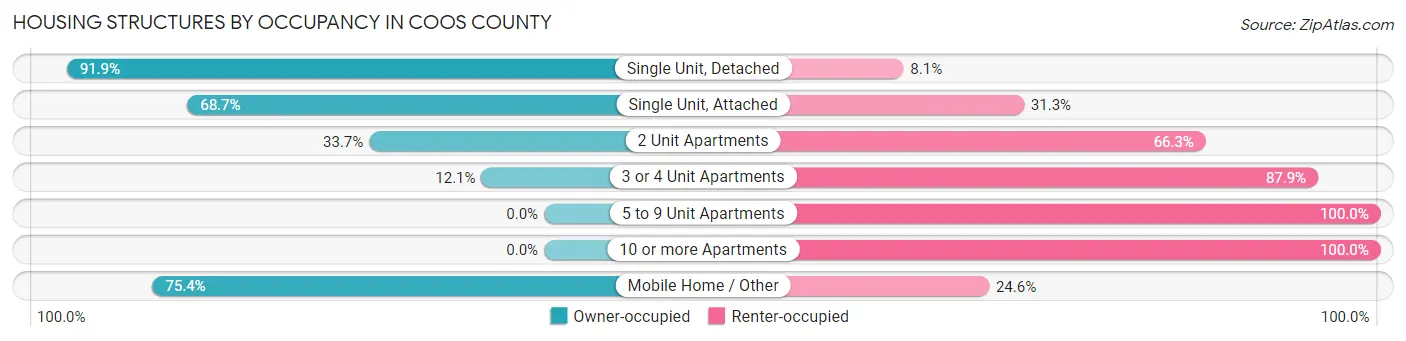
| Structure Type | Owner-occupied | Renter-occupied |
| Single Unit, Detached | 8,412 (91.9%) | 744 (8.1%) |
| Single Unit, Attached | 114 (68.7%) | 52 (31.3%) |
| 2 Unit Apartments | 369 (33.7%) | 727 (66.3%) |
| 3 or 4 Unit Apartments | 105 (12.1%) | 766 (87.9%) |
| 5 to 9 Unit Apartments | 0 (0.0%) | 432 (100.0%) |
| 10 or more Apartments | 0 (0.0%) | 623 (100.0%) |
| Mobile Home / Other | 962 (75.4%) | 314 (24.6%) |
| Total | 9,962 (73.1%) | 3,658 (26.9%) |
Housing Structures by Number of Rooms in Coos County
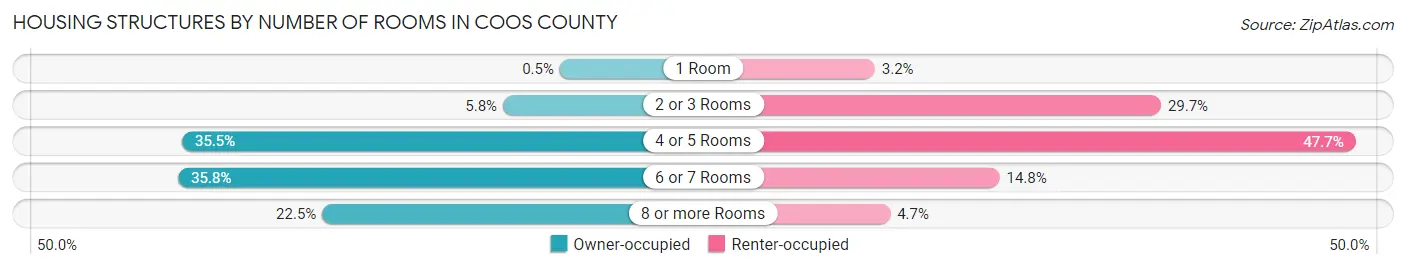
| Number of Rooms | Owner-occupied | Renter-occupied |
| 1 Room | 50 (0.5%) | 118 (3.2%) |
| 2 or 3 Rooms | 574 (5.8%) | 1,086 (29.7%) |
| 4 or 5 Rooms | 3,532 (35.4%) | 1,744 (47.7%) |
| 6 or 7 Rooms | 3,567 (35.8%) | 540 (14.8%) |
| 8 or more Rooms | 2,239 (22.5%) | 170 (4.6%) |
| Total | 9,962 (100.0%) | 3,658 (100.0%) |
Housing Structure by Heating Type in Coos County
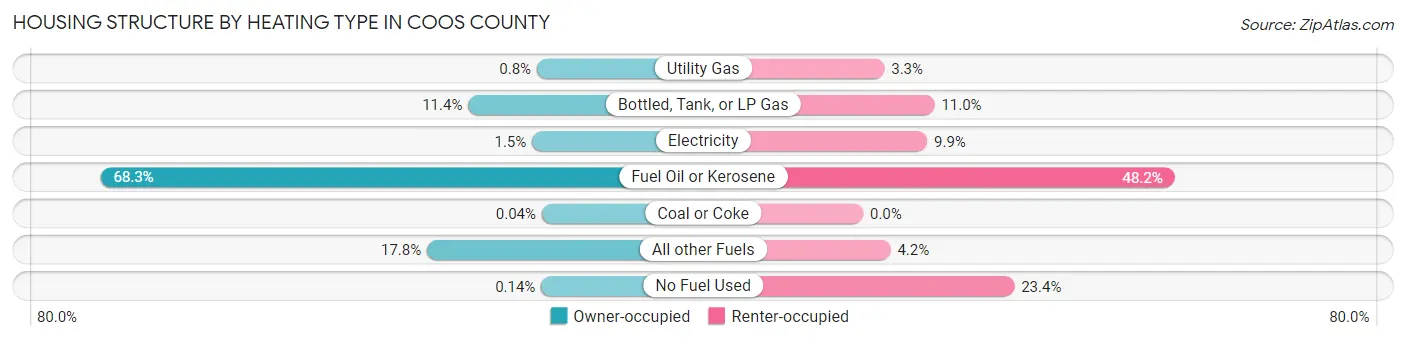
| Heating Type | Owner-occupied | Renter-occupied |
| Utility Gas | 80 (0.8%) | 120 (3.3%) |
| Bottled, Tank, or LP Gas | 1,138 (11.4%) | 404 (11.0%) |
| Electricity | 153 (1.5%) | 362 (9.9%) |
| Fuel Oil or Kerosene | 6,801 (68.3%) | 1,762 (48.2%) |
| Coal or Coke | 4 (0.0%) | 0 (0.0%) |
| All other Fuels | 1,772 (17.8%) | 155 (4.2%) |
| No Fuel Used | 14 (0.1%) | 855 (23.4%) |
| Total | 9,962 (100.0%) | 3,658 (100.0%) |
Household Vehicle Usage in Coos County
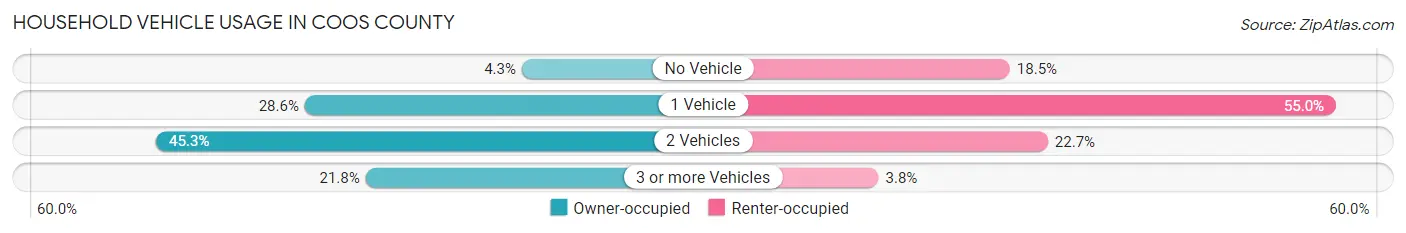
| Vehicles per Household | Owner-occupied | Renter-occupied |
| No Vehicle | 428 (4.3%) | 676 (18.5%) |
| 1 Vehicle | 2,851 (28.6%) | 2,012 (55.0%) |
| 2 Vehicles | 4,510 (45.3%) | 832 (22.7%) |
| 3 or more Vehicles | 2,173 (21.8%) | 138 (3.8%) |
| Total | 9,962 (100.0%) | 3,658 (100.0%) |
Real Estate & Mortgages in Coos County
Real Estate and Mortgage Overview in Coos County
| Characteristic | Without Mortgage | With Mortgage |
| Housing Units | 5,665 | 4,297 |
| Median Property Value | $158,900 | $156,800 |
| Median Household Income | $56,450 | $631 |
| Monthly Housing Costs | $649 | $136 |
| Real Estate Taxes | $3,239 | $77 |
Property Value by Mortgage Status in Coos County
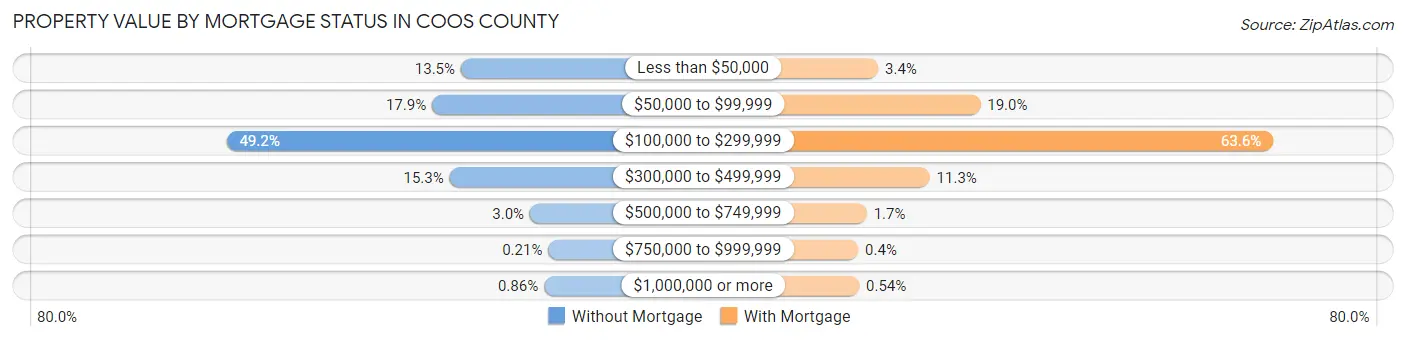
| Property Value | Without Mortgage | With Mortgage |
| Less than $50,000 | 766 (13.5%) | 148 (3.4%) |
| $50,000 to $99,999 | 1,015 (17.9%) | 817 (19.0%) |
| $100,000 to $299,999 | 2,789 (49.2%) | 2,734 (63.6%) |
| $300,000 to $499,999 | 864 (15.2%) | 485 (11.3%) |
| $500,000 to $749,999 | 170 (3.0%) | 73 (1.7%) |
| $750,000 to $999,999 | 12 (0.2%) | 17 (0.4%) |
| $1,000,000 or more | 49 (0.9%) | 23 (0.5%) |
| Total | 5,665 (100.0%) | 4,297 (100.0%) |
Household Income by Mortgage Status in Coos County
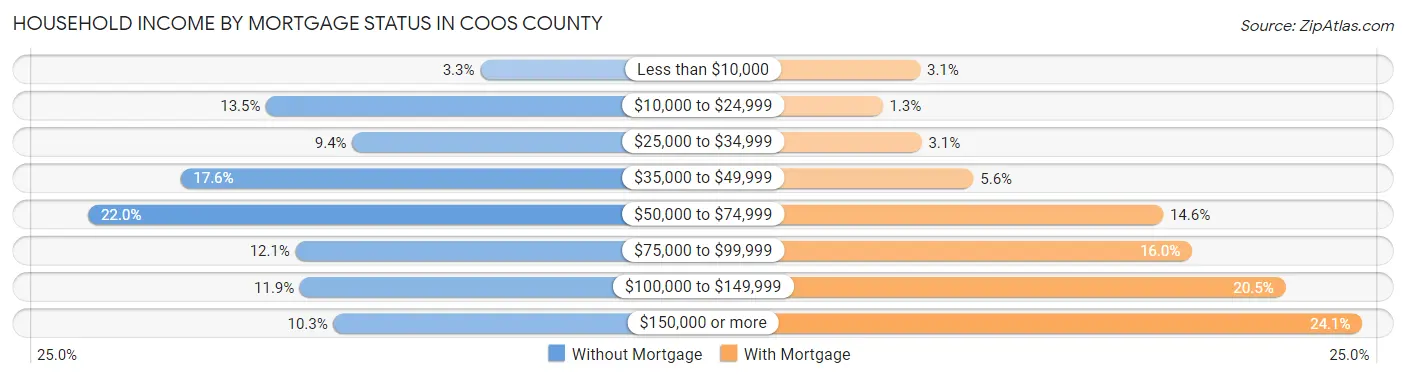
| Household Income | Without Mortgage | With Mortgage |
| Less than $10,000 | 187 (3.3%) | 132 (3.1%) |
| $10,000 to $24,999 | 764 (13.5%) | 55 (1.3%) |
| $25,000 to $34,999 | 532 (9.4%) | 135 (3.1%) |
| $35,000 to $49,999 | 996 (17.6%) | 241 (5.6%) |
| $50,000 to $74,999 | 1,245 (22.0%) | 629 (14.6%) |
| $75,000 to $99,999 | 685 (12.1%) | 689 (16.0%) |
| $100,000 to $149,999 | 673 (11.9%) | 880 (20.5%) |
| $150,000 or more | 583 (10.3%) | 1,037 (24.1%) |
| Total | 5,665 (100.0%) | 4,297 (100.0%) |
Property Value to Household Income Ratio in Coos County
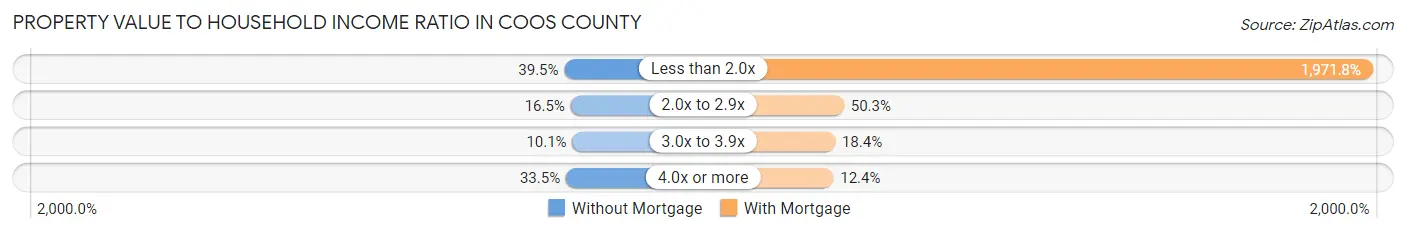
| Value-to-Income Ratio | Without Mortgage | With Mortgage |
| Less than 2.0x | 2,239 (39.5%) | 84,730 (1,971.8%) |
| 2.0x to 2.9x | 933 (16.5%) | 2,161 (50.3%) |
| 3.0x to 3.9x | 573 (10.1%) | 791 (18.4%) |
| 4.0x or more | 1,897 (33.5%) | 533 (12.4%) |
| Total | 5,665 (100.0%) | 4,297 (100.0%) |
Real Estate Taxes by Mortgage Status in Coos County
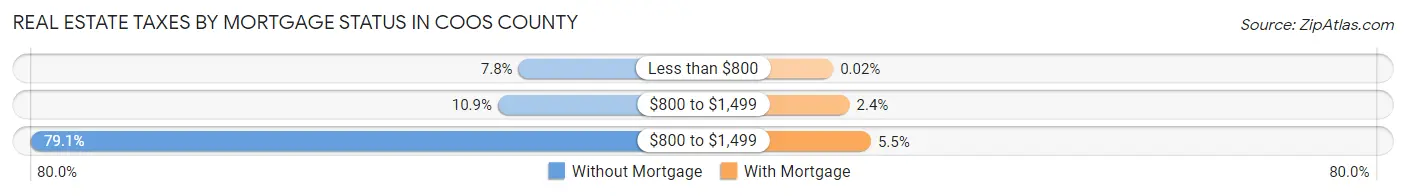
| Property Taxes | Without Mortgage | With Mortgage |
| Less than $800 | 444 (7.8%) | 1 (0.0%) |
| $800 to $1,499 | 615 (10.9%) | 104 (2.4%) |
| $800 to $1,499 | 4,479 (79.1%) | 238 (5.5%) |
| Total | 5,665 (100.0%) | 4,297 (100.0%) |
Health & Disability in Coos County
Health Insurance Coverage by Age in Coos County
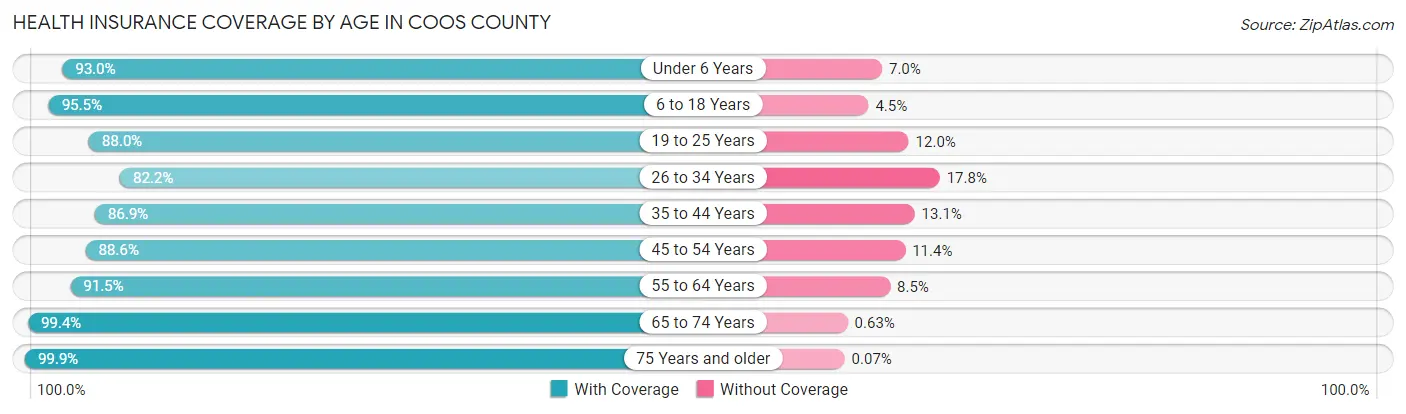
| Age Bracket | With Coverage | Without Coverage |
| Under 6 Years | 1,360 (93.0%) | 103 (7.0%) |
| 6 to 18 Years | 3,538 (95.5%) | 167 (4.5%) |
| 19 to 25 Years | 1,614 (88.0%) | 220 (12.0%) |
| 26 to 34 Years | 2,406 (82.2%) | 521 (17.8%) |
| 35 to 44 Years | 2,662 (86.9%) | 402 (13.1%) |
| 45 to 54 Years | 3,433 (88.6%) | 440 (11.4%) |
| 55 to 64 Years | 4,849 (91.5%) | 453 (8.5%) |
| 65 to 74 Years | 4,560 (99.4%) | 29 (0.6%) |
| 75 Years and older | 2,847 (99.9%) | 2 (0.1%) |
| Total | 27,269 (92.1%) | 2,337 (7.9%) |
Health Insurance Coverage by Citizenship Status in Coos County
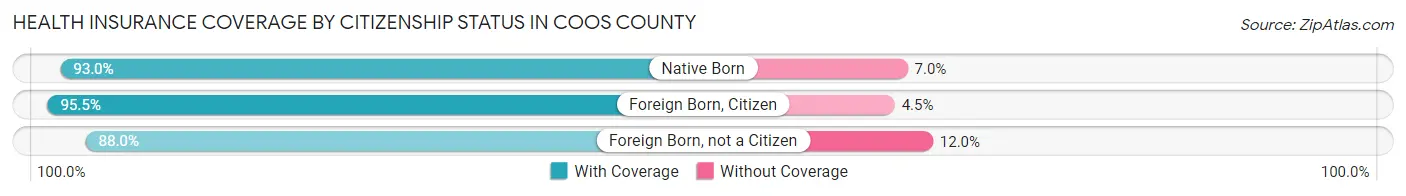
| Citizenship Status | With Coverage | Without Coverage |
| Native Born | 1,360 (93.0%) | 103 (7.0%) |
| Foreign Born, Citizen | 3,538 (95.5%) | 167 (4.5%) |
| Foreign Born, not a Citizen | 1,614 (88.0%) | 220 (12.0%) |
Health Insurance Coverage by Household Income in Coos County
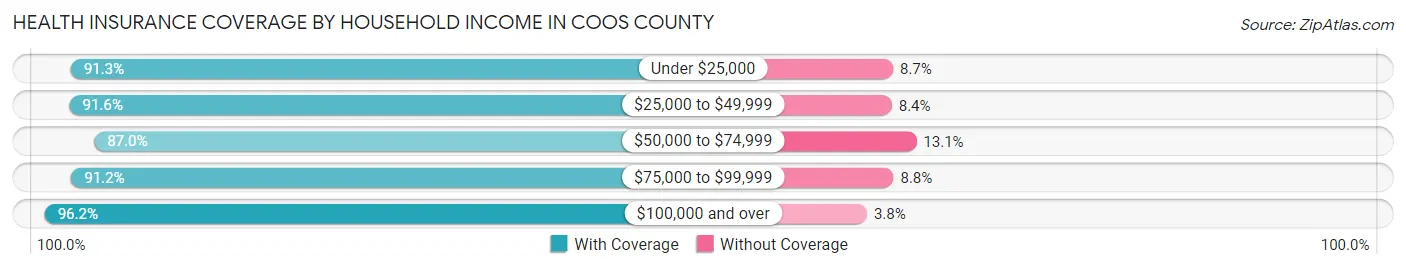
| Household Income | With Coverage | Without Coverage |
| Under $25,000 | 3,468 (91.3%) | 329 (8.7%) |
| $25,000 to $49,999 | 5,760 (91.6%) | 530 (8.4%) |
| $50,000 to $74,999 | 4,836 (87.0%) | 726 (13.1%) |
| $75,000 to $99,999 | 4,189 (91.2%) | 402 (8.8%) |
| $100,000 and over | 8,800 (96.2%) | 346 (3.8%) |
Public vs Private Health Insurance Coverage by Age in Coos County
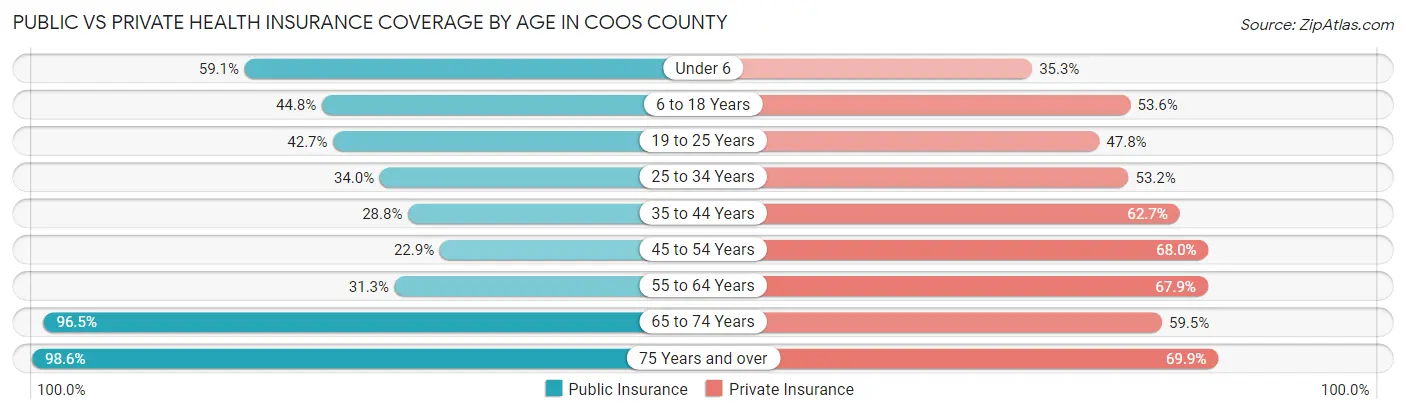
| Age Bracket | Public Insurance | Private Insurance |
| Under 6 | 865 (59.1%) | 517 (35.3%) |
| 6 to 18 Years | 1,659 (44.8%) | 1,986 (53.6%) |
| 19 to 25 Years | 783 (42.7%) | 877 (47.8%) |
| 25 to 34 Years | 996 (34.0%) | 1,558 (53.2%) |
| 35 to 44 Years | 882 (28.8%) | 1,921 (62.7%) |
| 45 to 54 Years | 887 (22.9%) | 2,635 (68.0%) |
| 55 to 64 Years | 1,658 (31.3%) | 3,600 (67.9%) |
| 65 to 74 Years | 4,427 (96.5%) | 2,728 (59.5%) |
| 75 Years and over | 2,809 (98.6%) | 1,990 (69.9%) |
| Total | 14,966 (50.5%) | 17,812 (60.2%) |
Disability Status by Sex by Age in Coos County
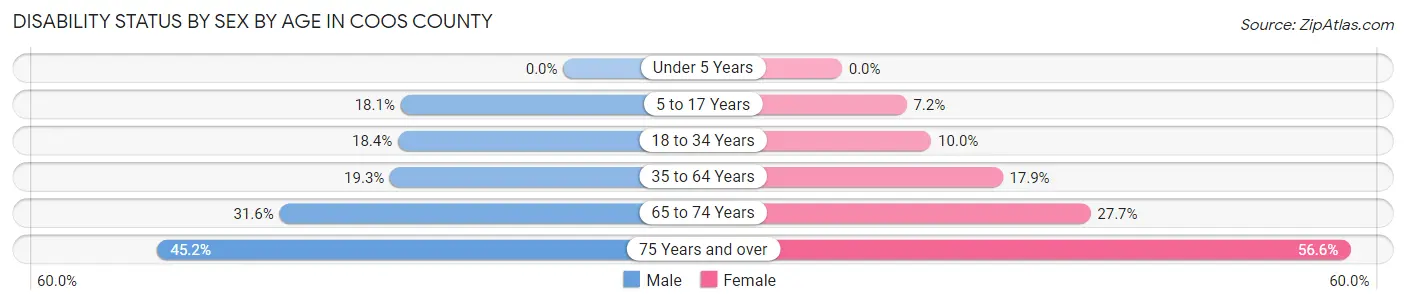
| Age Bracket | Male | Female |
| Under 5 Years | 0 (0.0%) | 0 (0.0%) |
| 5 to 17 Years | 347 (18.1%) | 129 (7.2%) |
| 18 to 34 Years | 508 (18.4%) | 226 (10.0%) |
| 35 to 64 Years | 1,206 (19.3%) | 1,071 (17.9%) |
| 65 to 74 Years | 739 (31.6%) | 623 (27.7%) |
| 75 Years and over | 569 (45.2%) | 900 (56.6%) |
Disability Class by Sex by Age in Coos County
Disability Class: Hearing Difficulty
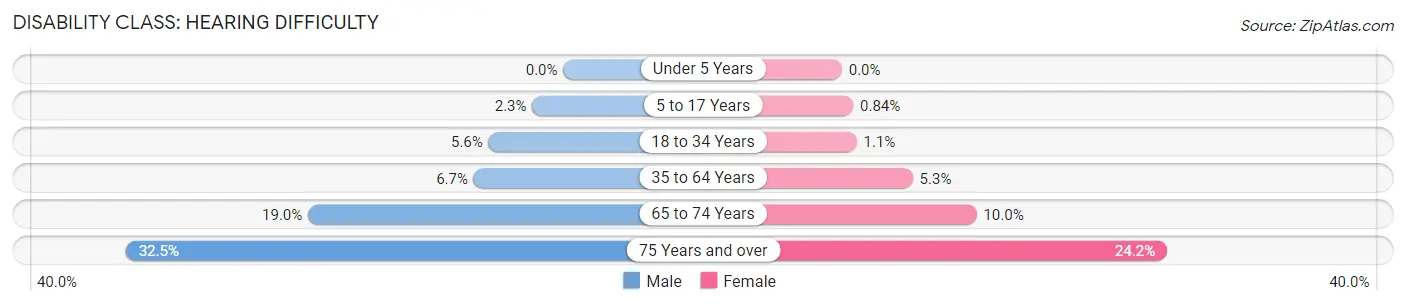
| Age Bracket | Male | Female |
| Under 5 Years | 0 (0.0%) | 0 (0.0%) |
| 5 to 17 Years | 44 (2.3%) | 15 (0.8%) |
| 18 to 34 Years | 153 (5.6%) | 25 (1.1%) |
| 35 to 64 Years | 416 (6.7%) | 315 (5.3%) |
| 65 to 74 Years | 443 (19.0%) | 225 (10.0%) |
| 75 Years and over | 409 (32.5%) | 384 (24.1%) |
Disability Class: Vision Difficulty
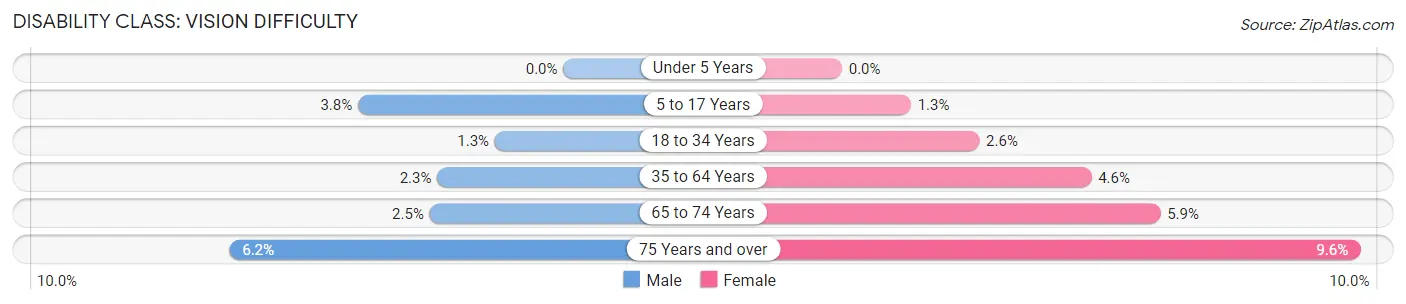
| Age Bracket | Male | Female |
| Under 5 Years | 0 (0.0%) | 0 (0.0%) |
| 5 to 17 Years | 73 (3.8%) | 23 (1.3%) |
| 18 to 34 Years | 35 (1.3%) | 58 (2.5%) |
| 35 to 64 Years | 146 (2.3%) | 277 (4.6%) |
| 65 to 74 Years | 58 (2.5%) | 133 (5.9%) |
| 75 Years and over | 78 (6.2%) | 153 (9.6%) |
Disability Class: Cognitive Difficulty
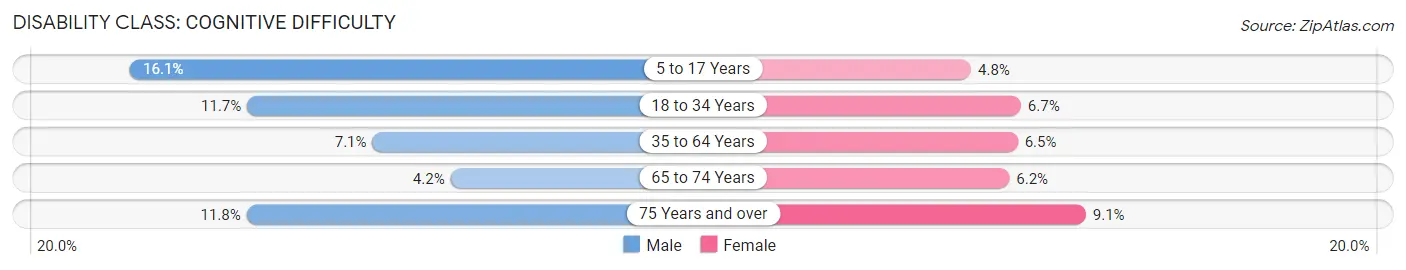
| Age Bracket | Male | Female |
| 5 to 17 Years | 308 (16.1%) | 86 (4.8%) |
| 18 to 34 Years | 324 (11.7%) | 151 (6.7%) |
| 35 to 64 Years | 443 (7.1%) | 391 (6.5%) |
| 65 to 74 Years | 98 (4.2%) | 140 (6.2%) |
| 75 Years and over | 148 (11.8%) | 144 (9.1%) |
Disability Class: Ambulatory Difficulty
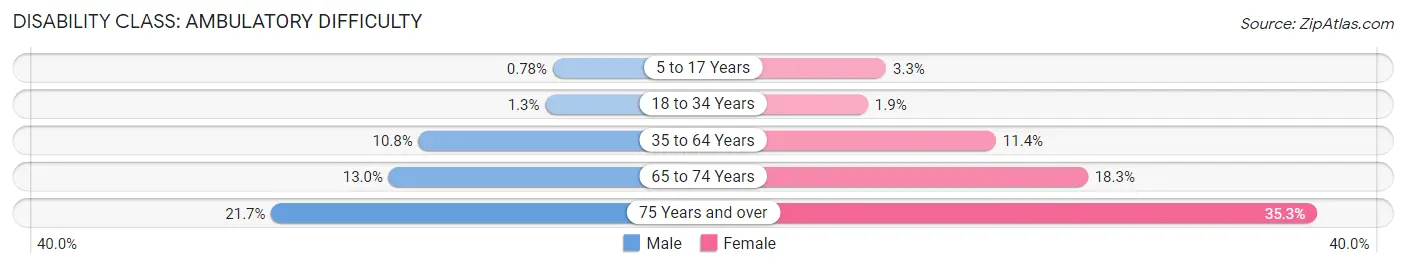
| Age Bracket | Male | Female |
| 5 to 17 Years | 15 (0.8%) | 59 (3.3%) |
| 18 to 34 Years | 37 (1.3%) | 44 (1.9%) |
| 35 to 64 Years | 672 (10.7%) | 685 (11.4%) |
| 65 to 74 Years | 303 (13.0%) | 411 (18.3%) |
| 75 Years and over | 273 (21.7%) | 561 (35.3%) |
Disability Class: Self-Care Difficulty
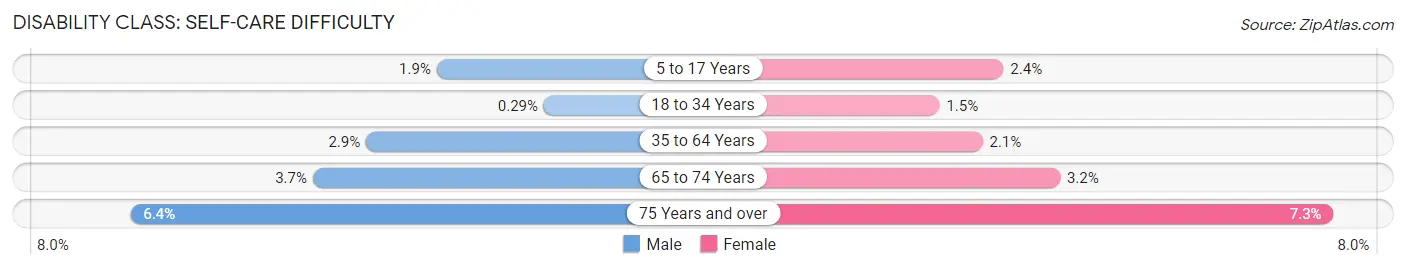
| Age Bracket | Male | Female |
| 5 to 17 Years | 36 (1.9%) | 43 (2.4%) |
| 18 to 34 Years | 8 (0.3%) | 33 (1.5%) |
| 35 to 64 Years | 183 (2.9%) | 125 (2.1%) |
| 65 to 74 Years | 87 (3.7%) | 73 (3.2%) |
| 75 Years and over | 81 (6.4%) | 116 (7.3%) |
Technology Access in Coos County
Computing Device Access in Coos County
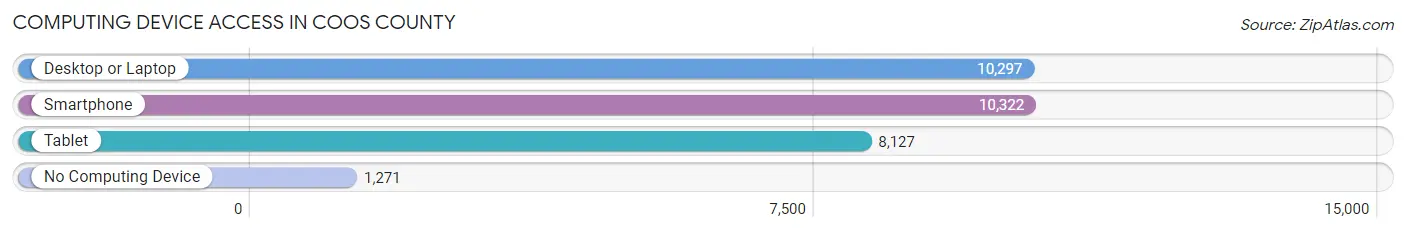
| Device Type | # Households | % Households |
| Desktop or Laptop | 10,297 | 75.6% |
| Smartphone | 10,322 | 75.8% |
| Tablet | 8,127 | 59.7% |
| No Computing Device | 1,271 | 9.3% |
| Total | 13,620 | 100.0% |
Internet Access in Coos County
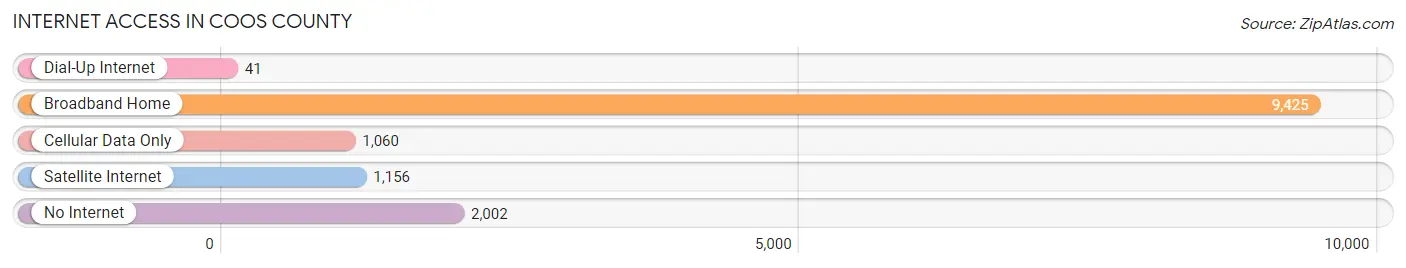
| Internet Type | # Households | % Households |
| Dial-Up Internet | 41 | 0.3% |
| Broadband Home | 9,425 | 69.2% |
| Cellular Data Only | 1,060 | 7.8% |
| Satellite Internet | 1,156 | 8.5% |
| No Internet | 2,002 | 14.7% |
| Total | 13,620 | 100.0% |
Coos County Summary
Coos County is located in the northern part of New Hampshire, and is the northernmost county in the state. It is bordered by the Canadian provinces of Quebec and New Brunswick to the north, and the states of Maine and Vermont to the east and west, respectively. The county seat is Lancaster, and the largest city is Berlin. The county has a total area of 1,845 square miles, making it the largest county in New Hampshire.
The county was established in 1840, and was named after the Coos tribe of Native Americans who lived in the area. The county was originally part of the state of Maine, but was annexed by New Hampshire in 1841.
The geography of Coos County is mostly mountainous, with the White Mountains to the east and the Green Mountains to the west. The highest point in the county is Mount Washington, which stands at 6,288 feet. The county is also home to several rivers, including the Androscoggin, Connecticut, and Saco.
The economy of Coos County is largely based on tourism, forestry, and manufacturing. The county is home to several ski resorts, including Attitash, Bretton Woods, and Wildcat Mountain. The county is also home to several paper mills, including the Berlin Mills Company and the Gorham Paper and Tissue Company.
The population of Coos County was 33,945 as of the 2010 census. The population is largely rural, with the majority of the population living in small towns and villages. The largest city in the county is Berlin, with a population of 10,051. The county is also home to several Native American tribes, including the Abenaki, Maliseet, and Penobscot.
The median household income in Coos County is $41,945, and the median family income is $50,945. The unemployment rate is 6.2%, which is slightly higher than the national average. The poverty rate is 13.3%, which is slightly higher than the national average.
Coos County is served by several school districts, including Berlin, Colebrook, Gorham, and Lancaster. The county is also home to several colleges and universities, including the University of New Hampshire at Berlin and White Mountains Community College.
Coos County is a beautiful and diverse area of New Hampshire, with a rich history and culture. The county is home to several ski resorts, paper mills, and Native American tribes, and is a popular tourist destination. The county is also home to several colleges and universities, and has a strong economy based on tourism, forestry, and manufacturing.
Common Questions
What is Per Capita Income in Coos County?
Per Capita income in Coos County is $32,570.
What is the Median Family Income in Coos County?
Median Family Income in Coos County is $74,857.
What is the Median Household income in Coos County?
Median Household Income in Coos County is $55,247.
What is Income or Wage Gap in Coos County?
Income or Wage Gap in Coos County is 22.2%.
Women in Coos County earn 77.8 cents for every dollar earned by a man.
What is Family Income Deficit in Coos County?
Family Income Deficit in Coos County is $9,729.
Families that are below poverty line in Coos County earn $9,729 less on average than the poverty threshold level.
What is Inequality or Gini Index in Coos County?
Inequality or Gini Index in Coos County is 0.43.
What is the Total Population of Coos County?
Total Population of Coos County is 31,430.
What is the Total Male Population of Coos County?
Total Male Population of Coos County is 16,638.
What is the Total Female Population of Coos County?
Total Female Population of Coos County is 14,792.
What is the Ratio of Males per 100 Females in Coos County?
There are 112.48 Males per 100 Females in Coos County.
What is the Ratio of Females per 100 Males in Coos County?
There are 88.90 Females per 100 Males in Coos County.
What is the Median Population Age in Coos County?
Median Population Age in Coos County is 49.7 Years.
What is the Average Family Size in Coos County
Average Family Size in Coos County is 2.7 People.
What is the Average Household Size in Coos County
Average Household Size in Coos County is 2.2 People.
How Large is the Labor Force in Coos County?
There are 15,083 People in the Labor Forcein in Coos County.
What is the Percentage of People in the Labor Force in Coos County?
55.5% of People are in the Labor Force in Coos County.
What is the Unemployment Rate in Coos County?
Unemployment Rate in Coos County is 4.2%.