Carroll County, NH Map & Demographics
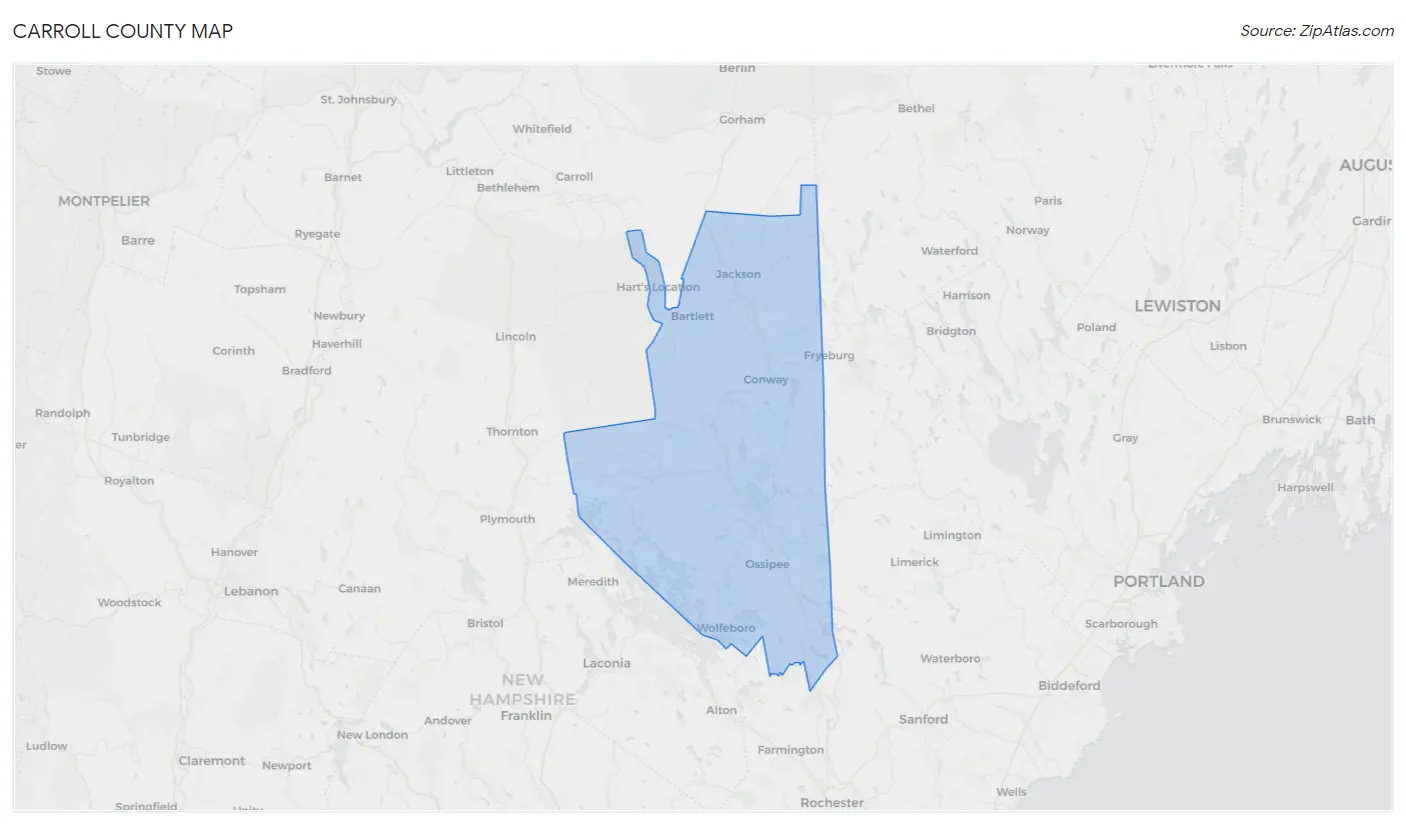
Carroll County Map
Carroll County Overview
$48,199
PER CAPITA INCOME
$94,101
AVG FAMILY INCOME
$77,049
AVG HOUSEHOLD INCOME
24.5%
WAGE / INCOME GAP [ % ]
75.5¢/ $1
WAGE / INCOME GAP [ $ ]
$10,269
FAMILY INCOME DEFICIT
0.48
INEQUALITY / GINI INDEX
50,679
TOTAL POPULATION
25,655
MALE POPULATION
25,024
FEMALE POPULATION
102.52
MALES / 100 FEMALES
97.54
FEMALES / 100 MALES
53.8
MEDIAN AGE
2.9
AVG FAMILY SIZE
2.3
AVG HOUSEHOLD SIZE
26,345
LABOR FORCE [ PEOPLE ]
59.8%
PERCENT IN LABOR FORCE
5.6%
UNEMPLOYMENT RATE
Carroll County Area Codes
Income in Carroll County
Income Overview in Carroll County
Per Capita Income in Carroll County is $48,199, while median incomes of families and households are $94,101 and $77,049 respectively.
| Characteristic | Number | Measure |
| Per Capita Income | 50,679 | $48,199 |
| Median Family Income | 13,526 | $94,101 |
| Mean Family Income | 13,526 | $126,405 |
| Median Household Income | 21,644 | $77,049 |
| Mean Household Income | 21,644 | $106,618 |
| Income Deficit | 13,526 | $10,269 |
| Wage / Income Gap (%) | 50,679 | 24.49% |
| Wage / Income Gap ($) | 50,679 | 75.51¢ per $1 |
| Gini / Inequality Index | 50,679 | 0.48 |
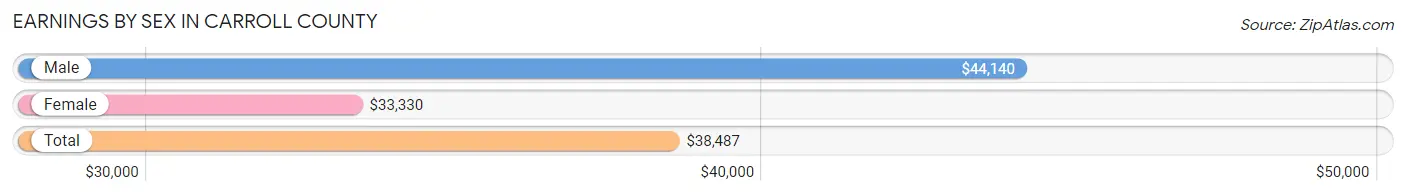
Earnings by Sex in Carroll County
Average Earnings in Carroll County are $38,487, $44,140 for men and $33,330 for women, a difference of 24.5%.
| Sex | Number | Average Earnings |
| Male | 14,899 (53.0%) | $44,140 |
| Female | 13,232 (47.0%) | $33,330 |
| Total | 28,131 (100.0%) | $38,487 |
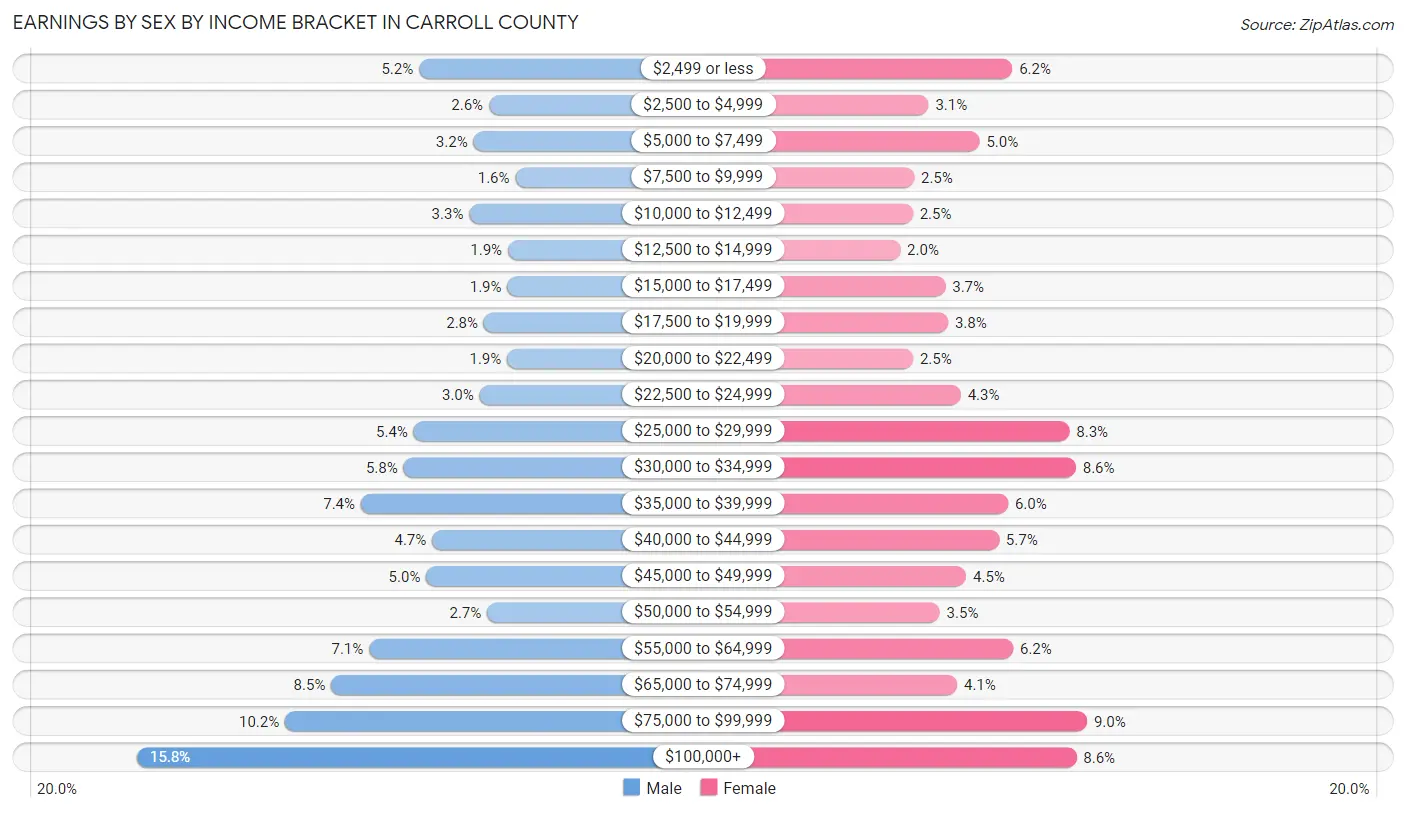
Earnings by Sex by Income Bracket in Carroll County
The most common earnings brackets in Carroll County are $100,000+ for men (2,353 | 15.8%) and $75,000 to $99,999 for women (1,191 | 9.0%).
| Income | Male | Female |
| $2,499 or less | 777 (5.2%) | 820 (6.2%) |
| $2,500 to $4,999 | 388 (2.6%) | 405 (3.1%) |
| $5,000 to $7,499 | 474 (3.2%) | 657 (5.0%) |
| $7,500 to $9,999 | 240 (1.6%) | 333 (2.5%) |
| $10,000 to $12,499 | 498 (3.3%) | 327 (2.5%) |
| $12,500 to $14,999 | 282 (1.9%) | 265 (2.0%) |
| $15,000 to $17,499 | 284 (1.9%) | 488 (3.7%) |
| $17,500 to $19,999 | 415 (2.8%) | 501 (3.8%) |
| $20,000 to $22,499 | 286 (1.9%) | 328 (2.5%) |
| $22,500 to $24,999 | 439 (2.9%) | 565 (4.3%) |
| $25,000 to $29,999 | 808 (5.4%) | 1,104 (8.3%) |
| $30,000 to $34,999 | 864 (5.8%) | 1,135 (8.6%) |
| $35,000 to $39,999 | 1,102 (7.4%) | 799 (6.0%) |
| $40,000 to $44,999 | 705 (4.7%) | 754 (5.7%) |
| $45,000 to $49,999 | 737 (5.0%) | 591 (4.5%) |
| $50,000 to $54,999 | 398 (2.7%) | 461 (3.5%) |
| $55,000 to $64,999 | 1,056 (7.1%) | 824 (6.2%) |
| $65,000 to $74,999 | 1,268 (8.5%) | 546 (4.1%) |
| $75,000 to $99,999 | 1,525 (10.2%) | 1,191 (9.0%) |
| $100,000+ | 2,353 (15.8%) | 1,138 (8.6%) |
| Total | 14,899 (100.0%) | 13,232 (100.0%) |
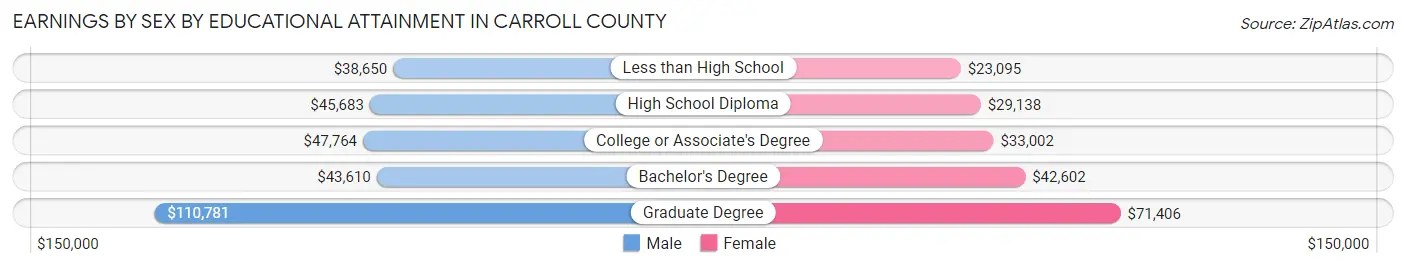
Earnings by Sex by Educational Attainment in Carroll County
Average earnings in Carroll County are $50,730 for men and $36,645 for women, a difference of 27.8%. Men with an educational attainment of graduate degree enjoy the highest average annual earnings of $110,781, while those with less than high school education earn the least with $38,650. Women with an educational attainment of graduate degree earn the most with the average annual earnings of $71,406, while those with less than high school education have the smallest earnings of $23,095.
| Educational Attainment | Male Income | Female Income |
| Less than High School | $38,650 | $23,095 |
| High School Diploma | $45,683 | $29,138 |
| College or Associate's Degree | $47,764 | $33,002 |
| Bachelor's Degree | $43,610 | $42,602 |
| Graduate Degree | $110,781 | $71,406 |
| Total | $50,730 | $36,645 |
Family Income in Carroll County
Family Income Brackets in Carroll County
According to the Carroll County family income data, there are 3,422 families falling into the $100,000 to $149,999 income range, which is the most common income bracket and makes up 25.3% of all families. Conversely, the $10,000 to $14,999 income bracket is the least frequent group with only 176 families (1.3%) belonging to this category.
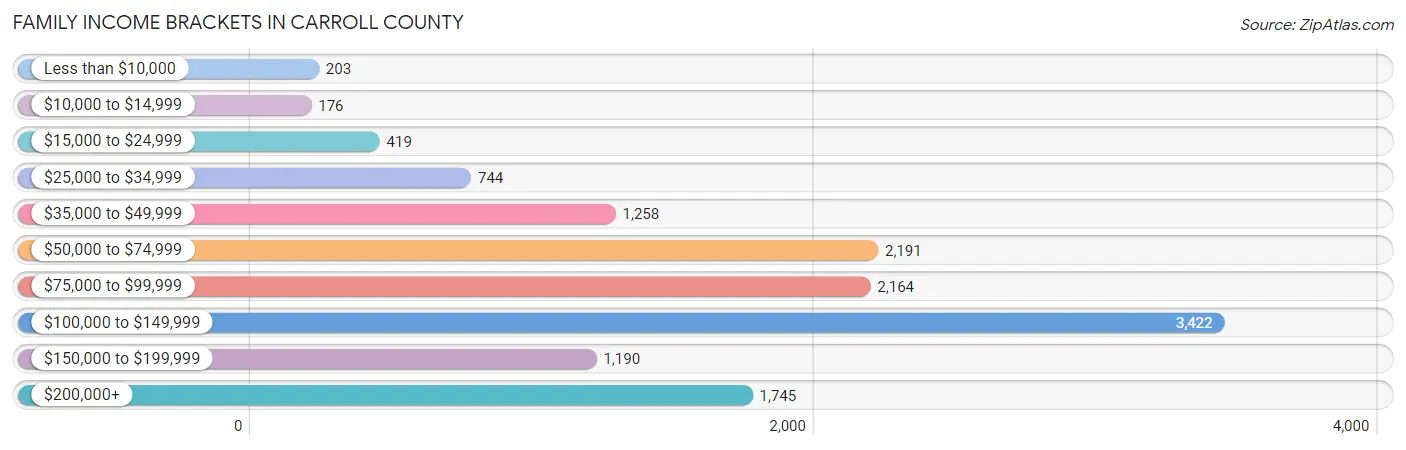
| Income Bracket | # Families | % Families |
| Less than $10,000 | 203 | 1.5% |
| $10,000 to $14,999 | 176 | 1.3% |
| $15,000 to $24,999 | 419 | 3.1% |
| $25,000 to $34,999 | 744 | 5.5% |
| $35,000 to $49,999 | 1,258 | 9.3% |
| $50,000 to $74,999 | 2,191 | 16.2% |
| $75,000 to $99,999 | 2,164 | 16.0% |
| $100,000 to $149,999 | 3,422 | 25.3% |
| $150,000 to $199,999 | 1,190 | 8.8% |
| $200,000+ | 1,745 | 12.9% |
Family Income by Famaliy Size in Carroll County
7+ person families (73 | 0.5%) account for the highest median family income in Carroll County with $236,528 per family, while 2-person families (8,848 | 65.4%) have the highest median income of $43,644 per family member.
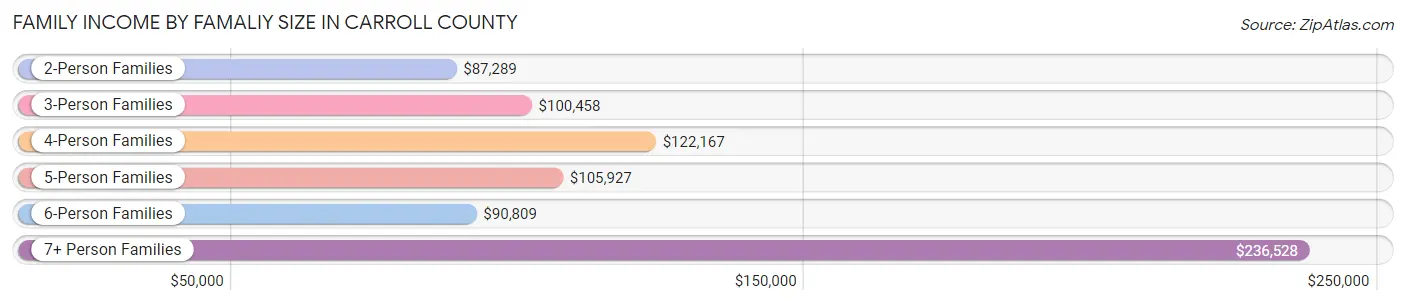
| Income Bracket | # Families | Median Income |
| 2-Person Families | 8,848 (65.4%) | $87,289 |
| 3-Person Families | 1,992 (14.7%) | $100,458 |
| 4-Person Families | 1,566 (11.6%) | $122,167 |
| 5-Person Families | 874 (6.5%) | $105,927 |
| 6-Person Families | 173 (1.3%) | $90,809 |
| 7+ Person Families | 73 (0.5%) | $236,528 |
| Total | 13,526 (100.0%) | $94,101 |
Family Income by Number of Earners in Carroll County
The median family income in Carroll County is $94,101, with families comprising 3+ earners (1,582) having the highest median family income of $137,020, while families with no earners (3,039) have the lowest median family income of $66,857, accounting for 11.7% and 22.5% of families, respectively.
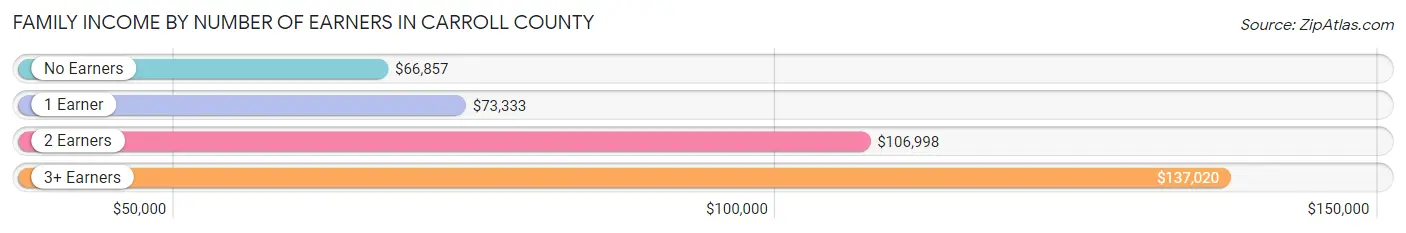
| Number of Earners | # Families | Median Income |
| No Earners | 3,039 (22.5%) | $66,857 |
| 1 Earner | 3,740 (27.7%) | $73,333 |
| 2 Earners | 5,165 (38.2%) | $106,998 |
| 3+ Earners | 1,582 (11.7%) | $137,020 |
| Total | 13,526 (100.0%) | $94,101 |
Household Income in Carroll County
Household Income Brackets in Carroll County
With 4,177 households falling in the category, the $100,000 to $149,999 income range is the most frequent in Carroll County, accounting for 19.3% of all households. In contrast, only 779 households (3.6%) fall into the less than $10,000 income bracket, making it the least populous group.
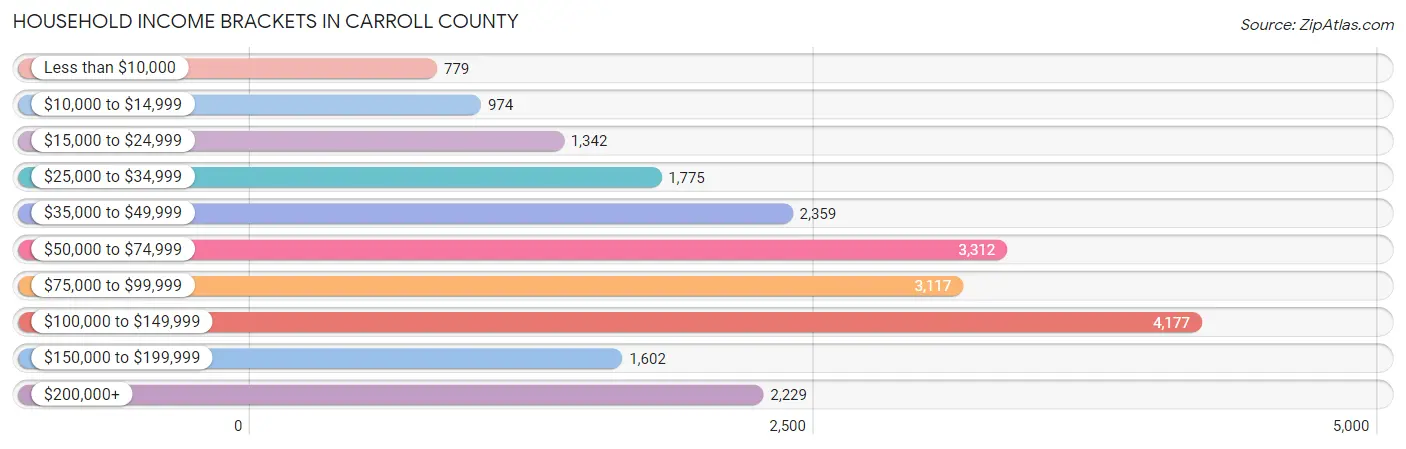
| Income Bracket | # Households | % Households |
| Less than $10,000 | 779 | 3.6% |
| $10,000 to $14,999 | 974 | 4.5% |
| $15,000 to $24,999 | 1,342 | 6.2% |
| $25,000 to $34,999 | 1,775 | 8.2% |
| $35,000 to $49,999 | 2,359 | 10.9% |
| $50,000 to $74,999 | 3,312 | 15.3% |
| $75,000 to $99,999 | 3,117 | 14.4% |
| $100,000 to $149,999 | 4,177 | 19.3% |
| $150,000 to $199,999 | 1,602 | 7.4% |
| $200,000+ | 2,229 | 10.3% |
Household Income by Householder Age in Carroll County
The median household income in Carroll County is $77,049, with the highest median household income of $89,945 found in the 25 to 44 years age bracket for the primary householder. A total of 3,737 households (17.3%) fall into this category. Meanwhile, the 15 to 24 years age bracket for the primary householder has the lowest median household income of $38,451, with 295 households (1.4%) in this group.
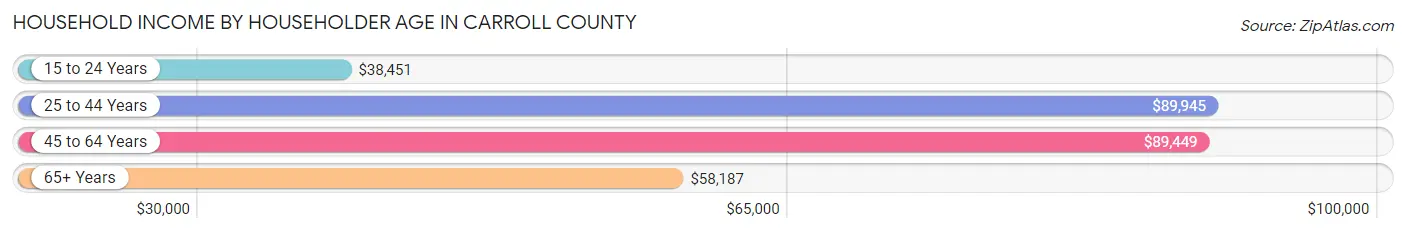
| Income Bracket | # Households | Median Income |
| 15 to 24 Years | 295 (1.4%) | $38,451 |
| 25 to 44 Years | 3,737 (17.3%) | $89,945 |
| 45 to 64 Years | 8,389 (38.8%) | $89,449 |
| 65+ Years | 9,223 (42.6%) | $58,187 |
| Total | 21,644 (100.0%) | $77,049 |
Poverty in Carroll County
Income Below Poverty by Sex and Age in Carroll County
With 7.3% poverty level for males and 8.7% for females among the residents of Carroll County, 16 and 17 year old males and 15 year old females are the most vulnerable to poverty, with 110 males (16.6%) and 90 females (37.3%) in their respective age groups living below the poverty level.
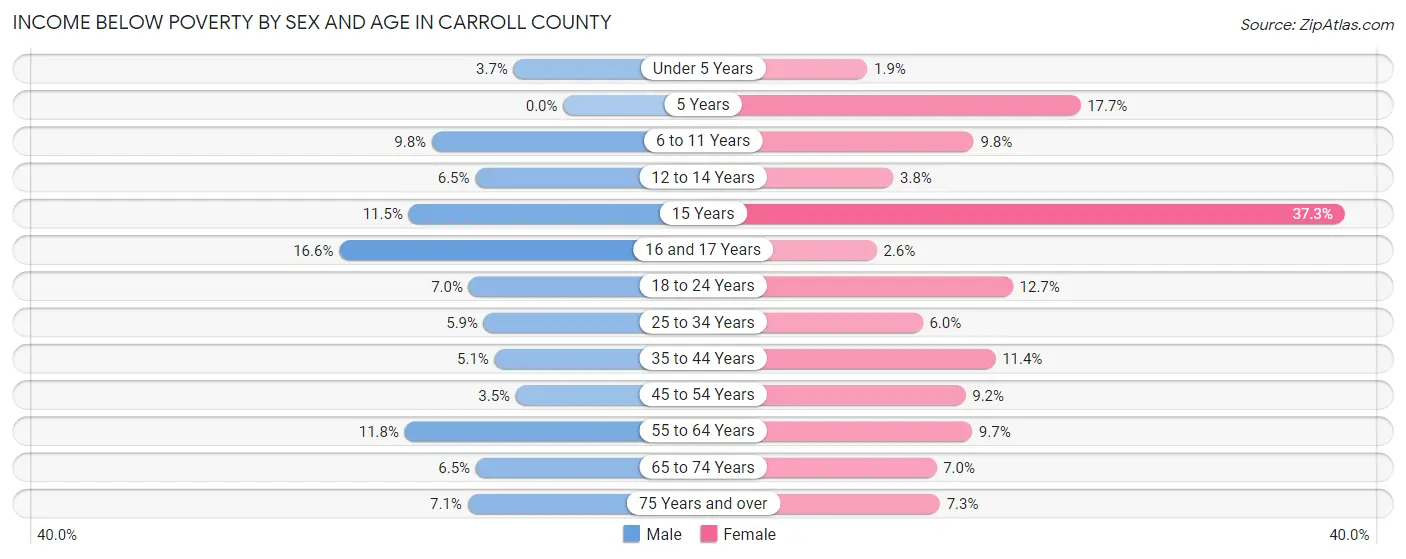
| Age Bracket | Male | Female |
| Under 5 Years | 32 (3.7%) | 14 (1.9%) |
| 5 Years | 0 (0.0%) | 37 (17.7%) |
| 6 to 11 Years | 136 (9.8%) | 118 (9.8%) |
| 12 to 14 Years | 46 (6.5%) | 21 (3.8%) |
| 15 Years | 14 (11.5%) | 90 (37.3%) |
| 16 and 17 Years | 110 (16.6%) | 11 (2.6%) |
| 18 to 24 Years | 113 (7.0%) | 172 (12.7%) |
| 25 to 34 Years | 144 (5.9%) | 135 (6.0%) |
| 35 to 44 Years | 119 (5.1%) | 280 (11.4%) |
| 45 to 54 Years | 108 (3.5%) | 275 (9.2%) |
| 55 to 64 Years | 546 (11.8%) | 472 (9.7%) |
| 65 to 74 Years | 298 (6.5%) | 313 (7.0%) |
| 75 Years and over | 187 (7.1%) | 207 (7.3%) |
| Total | 1,853 (7.3%) | 2,145 (8.7%) |
Income Above Poverty by Sex and Age in Carroll County
According to the poverty statistics in Carroll County, males aged 5 years and females aged under 5 years are the age groups that are most secure financially, with 100.0% of males and 98.1% of females in these age groups living above the poverty line.
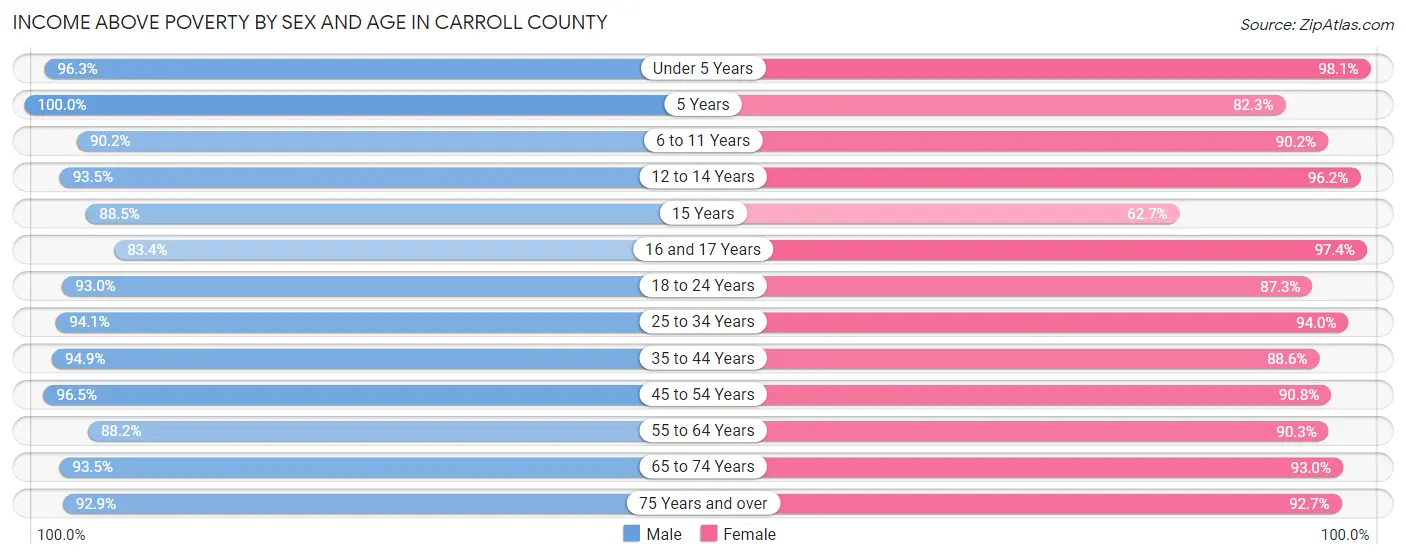
| Age Bracket | Male | Female |
| Under 5 Years | 836 (96.3%) | 732 (98.1%) |
| 5 Years | 275 (100.0%) | 172 (82.3%) |
| 6 to 11 Years | 1,257 (90.2%) | 1,088 (90.2%) |
| 12 to 14 Years | 658 (93.5%) | 530 (96.2%) |
| 15 Years | 108 (88.5%) | 151 (62.7%) |
| 16 and 17 Years | 551 (83.4%) | 415 (97.4%) |
| 18 to 24 Years | 1,497 (93.0%) | 1,184 (87.3%) |
| 25 to 34 Years | 2,296 (94.1%) | 2,117 (94.0%) |
| 35 to 44 Years | 2,216 (94.9%) | 2,178 (88.6%) |
| 45 to 54 Years | 2,956 (96.5%) | 2,725 (90.8%) |
| 55 to 64 Years | 4,093 (88.2%) | 4,412 (90.3%) |
| 65 to 74 Years | 4,293 (93.5%) | 4,151 (93.0%) |
| 75 Years and over | 2,446 (92.9%) | 2,642 (92.7%) |
| Total | 23,482 (92.7%) | 22,497 (91.3%) |
Income Below Poverty Among Married-Couple Families in Carroll County
The poverty statistics for married-couple families in Carroll County show that 3.0% or 331 of the total 11,178 families live below the poverty line. Families with 1 or 2 children have the highest poverty rate of 5.1%, comprising of 97 families. On the other hand, families with 3 or 4 children have the lowest poverty rate of 0.0%, which includes 0 families.
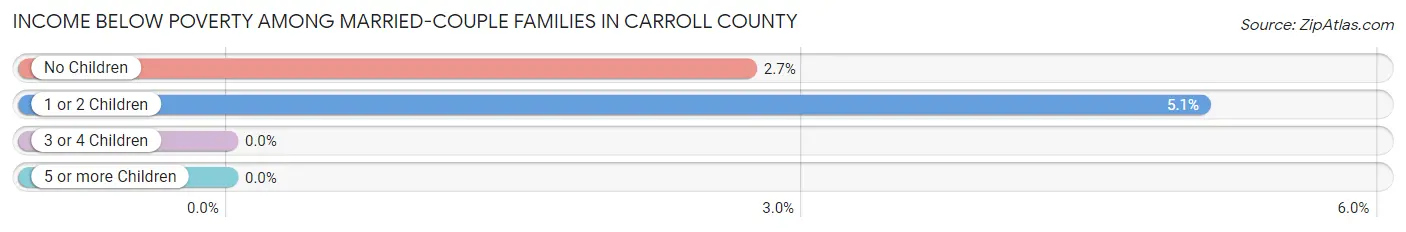
| Children | Above Poverty | Below Poverty |
| No Children | 8,397 (97.3%) | 234 (2.7%) |
| 1 or 2 Children | 1,812 (94.9%) | 97 (5.1%) |
| 3 or 4 Children | 591 (100.0%) | 0 (0.0%) |
| 5 or more Children | 47 (100.0%) | 0 (0.0%) |
| Total | 10,847 (97.0%) | 331 (3.0%) |
Income Below Poverty Among Single-Parent Households in Carroll County
According to the poverty data in Carroll County, 10.5% or 86 single-father households and 14.1% or 215 single-mother households are living below the poverty line. Among single-father households, those with 1 or 2 children have the highest poverty rate, with 63 households (19.5%) experiencing poverty. Likewise, among single-mother households, those with 3 or 4 children have the highest poverty rate, with 65 households (32.7%) falling below the poverty line.
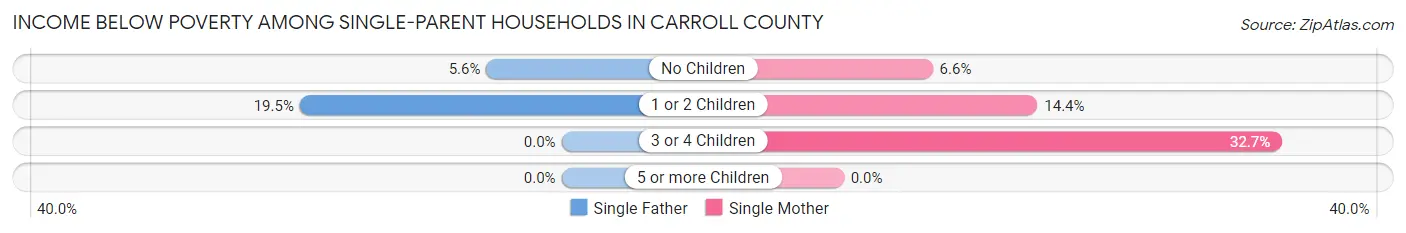
| Children | Single Father | Single Mother |
| No Children | 23 (5.6%) | 35 (6.6%) |
| 1 or 2 Children | 63 (19.5%) | 115 (14.4%) |
| 3 or 4 Children | 0 (0.0%) | 65 (32.7%) |
| 5 or more Children | 0 (0.0%) | 0 (0.0%) |
| Total | 86 (10.5%) | 215 (14.1%) |
Income Below Poverty Among Married-Couple vs Single-Parent Households in Carroll County
The poverty data for Carroll County shows that 331 of the married-couple family households (3.0%) and 301 of the single-parent households (12.8%) are living below the poverty level. Within the married-couple family households, those with 1 or 2 children have the highest poverty rate, with 97 households (5.1%) falling below the poverty line. Among the single-parent households, those with 3 or 4 children have the highest poverty rate, with 65 household (23.4%) living below poverty.
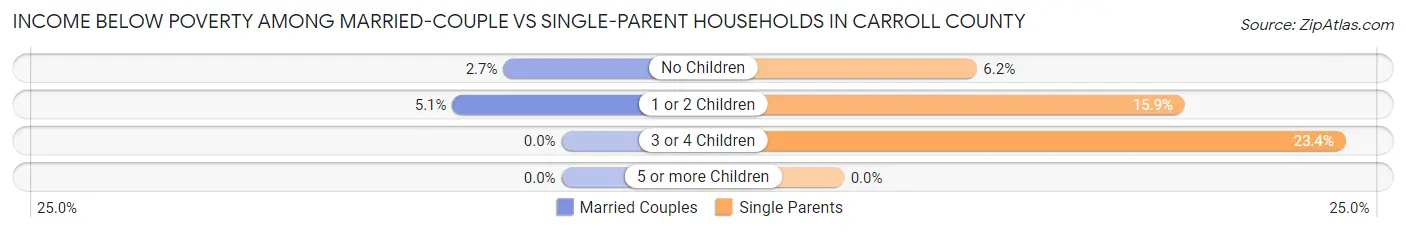
| Children | Married-Couple Families | Single-Parent Households |
| No Children | 234 (2.7%) | 58 (6.2%) |
| 1 or 2 Children | 97 (5.1%) | 178 (15.9%) |
| 3 or 4 Children | 0 (0.0%) | 65 (23.4%) |
| 5 or more Children | 0 (0.0%) | 0 (0.0%) |
| Total | 331 (3.0%) | 301 (12.8%) |
Race in Carroll County
The most populous races in Carroll County are White / Caucasian (48,417 | 95.5%), Two or more Races (1,187 | 2.3%), and Hispanic or Latino (847 | 1.7%).
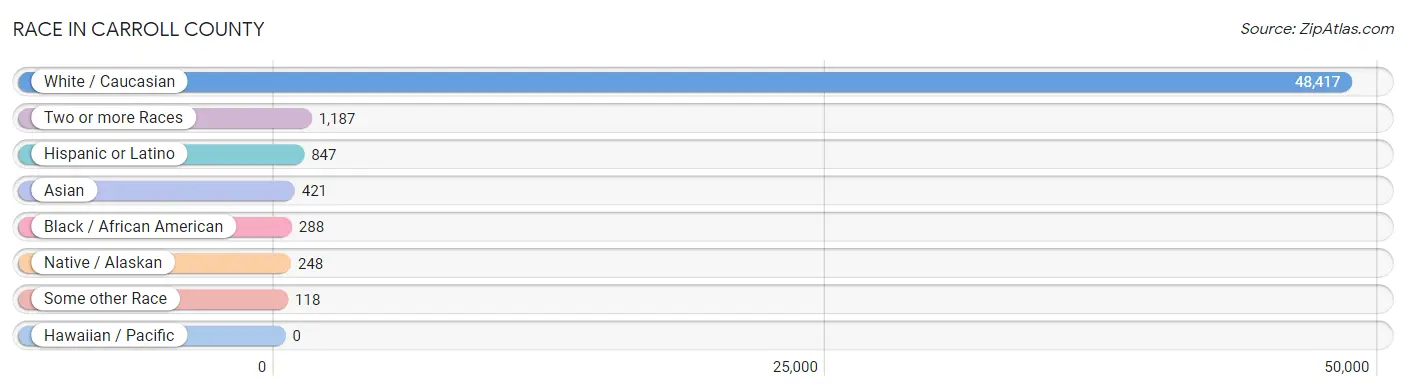
| Race | # Population | % Population |
| Asian | 421 | 0.8% |
| Black / African American | 288 | 0.6% |
| Hawaiian / Pacific | 0 | 0.0% |
| Hispanic or Latino | 847 | 1.7% |
| Native / Alaskan | 248 | 0.5% |
| White / Caucasian | 48,417 | 95.5% |
| Two or more Races | 1,187 | 2.3% |
| Some other Race | 118 | 0.2% |
| Total | 50,679 | 100.0% |
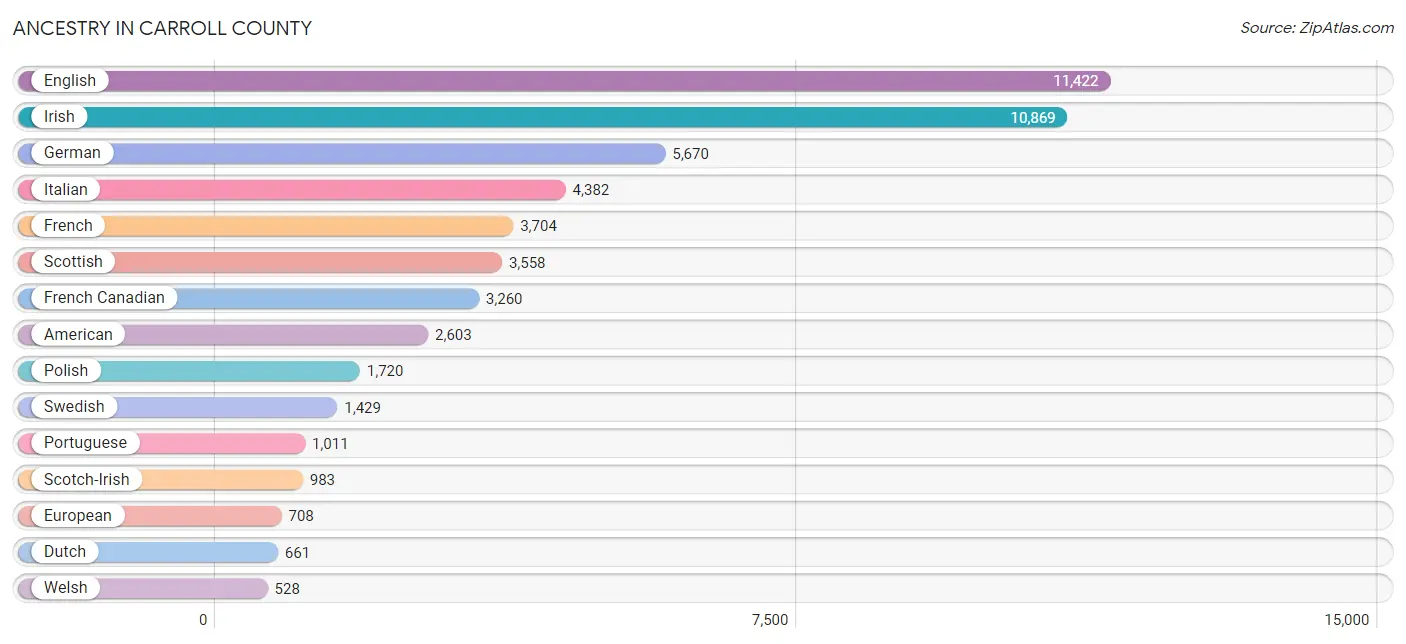
Ancestry in Carroll County
The most populous ancestries reported in Carroll County are English (11,422 | 22.5%), Irish (10,869 | 21.4%), German (5,670 | 11.2%), Italian (4,382 | 8.6%), and French (3,704 | 7.3%), together accounting for 71.1% of all Carroll County residents.
| Ancestry | # Population | % Population |
| American | 2,603 | 5.1% |
| Arab | 49 | 0.1% |
| Argentinean | 5 | 0.0% |
| Armenian | 44 | 0.1% |
| Austrian | 142 | 0.3% |
| Belgian | 34 | 0.1% |
| Bhutanese | 58 | 0.1% |
| Brazilian | 14 | 0.0% |
| British | 261 | 0.5% |
| Bulgarian | 2 | 0.0% |
| Burmese | 26 | 0.1% |
| Cajun | 11 | 0.0% |
| Canadian | 470 | 0.9% |
| Cape Verdean | 9 | 0.0% |
| Celtic | 166 | 0.3% |
| Central American | 27 | 0.1% |
| Central American Indian | 5 | 0.0% |
| Cherokee | 87 | 0.2% |
| Chinese | 13 | 0.0% |
| Colombian | 22 | 0.0% |
| Costa Rican | 2 | 0.0% |
| Croatian | 1 | 0.0% |
| Cuban | 8 | 0.0% |
| Czech | 91 | 0.2% |
| Czechoslovakian | 22 | 0.0% |
| Danish | 141 | 0.3% |
| Dominican | 29 | 0.1% |
| Dutch | 661 | 1.3% |
| Eastern European | 89 | 0.2% |
| Ecuadorian | 77 | 0.2% |
| English | 11,422 | 22.5% |
| European | 708 | 1.4% |
| Finnish | 149 | 0.3% |
| French | 3,704 | 7.3% |
| French Canadian | 3,260 | 6.4% |
| German | 5,670 | 11.2% |
| Greek | 340 | 0.7% |
| Guatemalan | 9 | 0.0% |
| Haitian | 3 | 0.0% |
| Hungarian | 78 | 0.2% |
| Icelander | 3 | 0.0% |
| Indian (Asian) | 90 | 0.2% |
| Iranian | 60 | 0.1% |
| Irish | 10,869 | 21.4% |
| Iroquois | 3 | 0.0% |
| Israeli | 13 | 0.0% |
| Italian | 4,382 | 8.6% |
| Jamaican | 28 | 0.1% |
| Korean | 20 | 0.0% |
| Laotian | 3 | 0.0% |
| Latvian | 30 | 0.1% |
| Lebanese | 46 | 0.1% |
| Lithuanian | 174 | 0.3% |
| Maltese | 79 | 0.2% |
| Mexican | 115 | 0.2% |
| Navajo | 37 | 0.1% |
| New Zealander | 4 | 0.0% |
| Nigerian | 2 | 0.0% |
| Northern European | 119 | 0.2% |
| Norwegian | 462 | 0.9% |
| Pakistani | 23 | 0.1% |
| Pennsylvania German | 88 | 0.2% |
| Peruvian | 5 | 0.0% |
| Polish | 1,720 | 3.4% |
| Portuguese | 1,011 | 2.0% |
| Puerto Rican | 425 | 0.8% |
| Romanian | 27 | 0.1% |
| Russian | 521 | 1.0% |
| Salvadoran | 16 | 0.0% |
| Scandinavian | 216 | 0.4% |
| Scotch-Irish | 983 | 1.9% |
| Scottish | 3,558 | 7.0% |
| Slovak | 69 | 0.1% |
| South American | 124 | 0.2% |
| Spaniard | 29 | 0.1% |
| Spanish | 77 | 0.2% |
| Sri Lankan | 20 | 0.0% |
| Subsaharan African | 19 | 0.0% |
| Swedish | 1,429 | 2.8% |
| Swiss | 150 | 0.3% |
| Thai | 217 | 0.4% |
| Trinidadian and Tobagonian | 13 | 0.0% |
| Ukrainian | 167 | 0.3% |
| Vietnamese | 16 | 0.0% |
| Welsh | 528 | 1.0% |
| West Indian | 4 | 0.0% |
| Yugoslavian | 8 | 0.0% | View All 87 Rows |
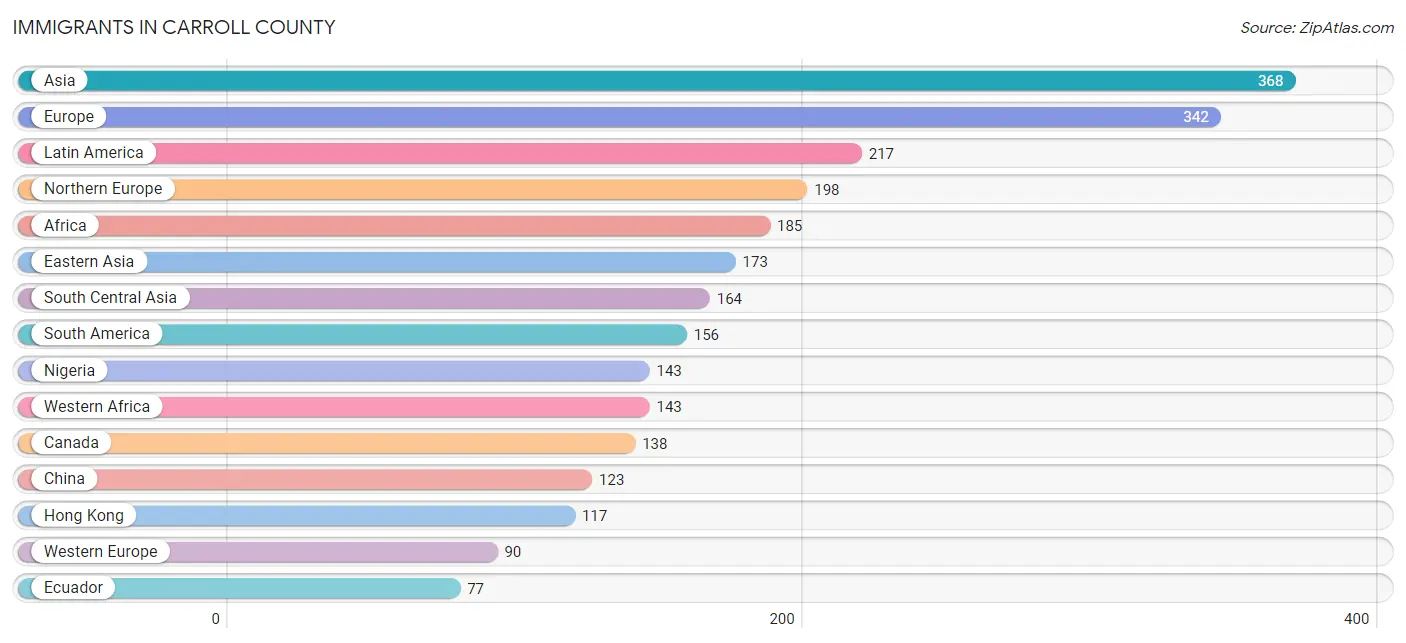
Immigrants in Carroll County
The most numerous immigrant groups reported in Carroll County came from Asia (368 | 0.7%), Europe (342 | 0.7%), Latin America (217 | 0.4%), Northern Europe (198 | 0.4%), and Africa (185 | 0.4%), together accounting for 2.6% of all Carroll County residents.
| Immigration Origin | # Population | % Population |
| Africa | 185 | 0.4% |
| Asia | 368 | 0.7% |
| Austria | 6 | 0.0% |
| Bahamas | 1 | 0.0% |
| Bangladesh | 16 | 0.0% |
| Bosnia and Herzegovina | 3 | 0.0% |
| Canada | 138 | 0.3% |
| Caribbean | 34 | 0.1% |
| Central America | 27 | 0.1% |
| China | 123 | 0.2% |
| Colombia | 22 | 0.0% |
| Eastern Africa | 2 | 0.0% |
| Eastern Asia | 173 | 0.3% |
| Eastern Europe | 32 | 0.1% |
| Ecuador | 77 | 0.2% |
| El Salvador | 21 | 0.0% |
| England | 42 | 0.1% |
| Europe | 342 | 0.7% |
| Germany | 64 | 0.1% |
| Greece | 4 | 0.0% |
| Haiti | 3 | 0.0% |
| Hong Kong | 117 | 0.2% |
| India | 58 | 0.1% |
| Iran | 60 | 0.1% |
| Ireland | 38 | 0.1% |
| Jamaica | 27 | 0.1% |
| Japan | 31 | 0.1% |
| Kazakhstan | 12 | 0.0% |
| Korea | 19 | 0.0% |
| Latin America | 217 | 0.4% |
| Mexico | 6 | 0.0% |
| Netherlands | 20 | 0.0% |
| Nigeria | 143 | 0.3% |
| Northern Europe | 198 | 0.4% |
| Norway | 34 | 0.1% |
| Oceania | 37 | 0.1% |
| Pakistan | 18 | 0.0% |
| Peru | 5 | 0.0% |
| Philippines | 15 | 0.0% |
| Poland | 12 | 0.0% |
| Portugal | 18 | 0.0% |
| Scotland | 8 | 0.0% |
| South America | 156 | 0.3% |
| South Central Asia | 164 | 0.3% |
| South Eastern Asia | 31 | 0.1% |
| Southern Europe | 22 | 0.0% |
| Sweden | 32 | 0.1% |
| Taiwan | 6 | 0.0% |
| Thailand | 12 | 0.0% |
| Ukraine | 7 | 0.0% |
| Vietnam | 4 | 0.0% |
| Western Africa | 143 | 0.3% |
| Western Europe | 90 | 0.2% | View All 53 Rows |
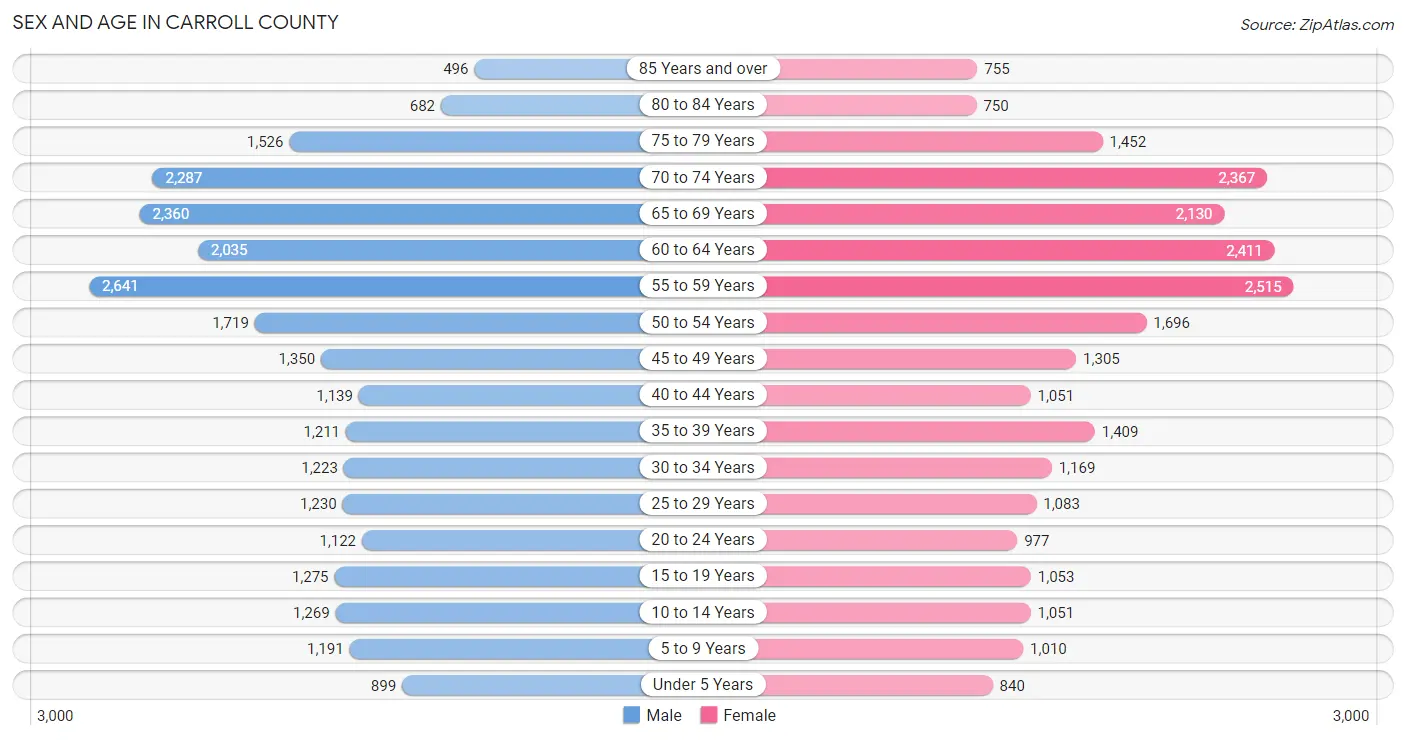
Sex and Age in Carroll County
Sex and Age in Carroll County
The most populous age groups in Carroll County are 55 to 59 Years (2,641 | 10.3%) for men and 55 to 59 Years (2,515 | 10.1%) for women.
| Age Bracket | Male | Female |
| Under 5 Years | 899 (3.5%) | 840 (3.4%) |
| 5 to 9 Years | 1,191 (4.6%) | 1,010 (4.0%) |
| 10 to 14 Years | 1,269 (5.0%) | 1,051 (4.2%) |
| 15 to 19 Years | 1,275 (5.0%) | 1,053 (4.2%) |
| 20 to 24 Years | 1,122 (4.4%) | 977 (3.9%) |
| 25 to 29 Years | 1,230 (4.8%) | 1,083 (4.3%) |
| 30 to 34 Years | 1,223 (4.8%) | 1,169 (4.7%) |
| 35 to 39 Years | 1,211 (4.7%) | 1,409 (5.6%) |
| 40 to 44 Years | 1,139 (4.4%) | 1,051 (4.2%) |
| 45 to 49 Years | 1,350 (5.3%) | 1,305 (5.2%) |
| 50 to 54 Years | 1,719 (6.7%) | 1,696 (6.8%) |
| 55 to 59 Years | 2,641 (10.3%) | 2,515 (10.1%) |
| 60 to 64 Years | 2,035 (7.9%) | 2,411 (9.6%) |
| 65 to 69 Years | 2,360 (9.2%) | 2,130 (8.5%) |
| 70 to 74 Years | 2,287 (8.9%) | 2,367 (9.5%) |
| 75 to 79 Years | 1,526 (5.9%) | 1,452 (5.8%) |
| 80 to 84 Years | 682 (2.7%) | 750 (3.0%) |
| 85 Years and over | 496 (1.9%) | 755 (3.0%) |
| Total | 25,655 (100.0%) | 25,024 (100.0%) |
Families and Households in Carroll County
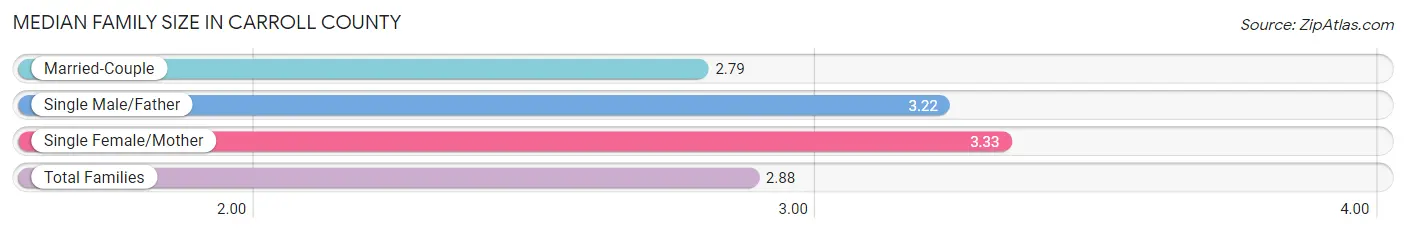
Median Family Size in Carroll County
The median family size in Carroll County is 2.88 persons per family, with single female/mother families (1,526 | 11.3%) accounting for the largest median family size of 3.33 persons per family. On the other hand, married-couple families (11,178 | 82.6%) represent the smallest median family size with 2.79 persons per family.
| Family Type | # Families | Family Size |
| Married-Couple | 11,178 (82.6%) | 2.79 |
| Single Male/Father | 822 (6.1%) | 3.22 |
| Single Female/Mother | 1,526 (11.3%) | 3.33 |
| Total Families | 13,526 (100.0%) | 2.88 |
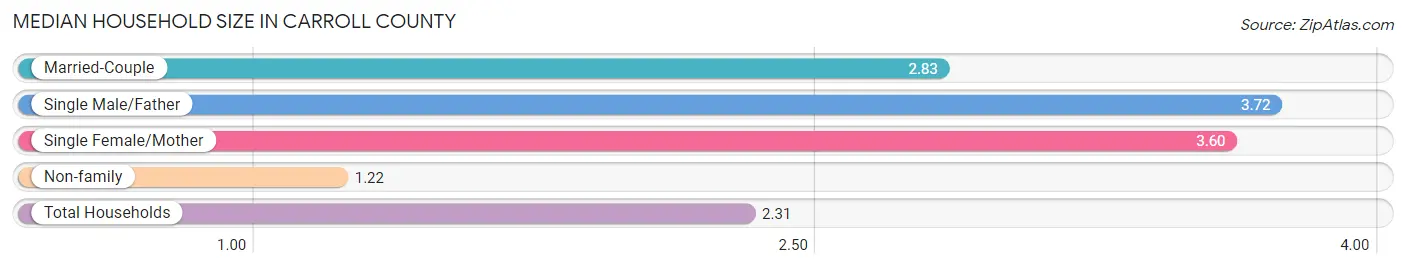
Median Household Size in Carroll County
The median household size in Carroll County is 2.31 persons per household, with single male/father households (822 | 3.8%) accounting for the largest median household size of 3.72 persons per household. non-family households (8,118 | 37.5%) represent the smallest median household size with 1.22 persons per household.
| Household Type | # Households | Household Size |
| Married-Couple | 11,178 (51.6%) | 2.83 |
| Single Male/Father | 822 (3.8%) | 3.72 |
| Single Female/Mother | 1,526 (7.0%) | 3.60 |
| Non-family | 8,118 (37.5%) | 1.22 |
| Total Households | 21,644 (100.0%) | 2.31 |
Household Size by Marriage Status in Carroll County
Out of a total of 21,644 households in Carroll County, 13,526 (62.5%) are family households, while 8,118 (37.5%) are nonfamily households. The most numerous type of family households are 2-person households, comprising 8,592, and the most common type of nonfamily households are 1-person households, comprising 6,751.
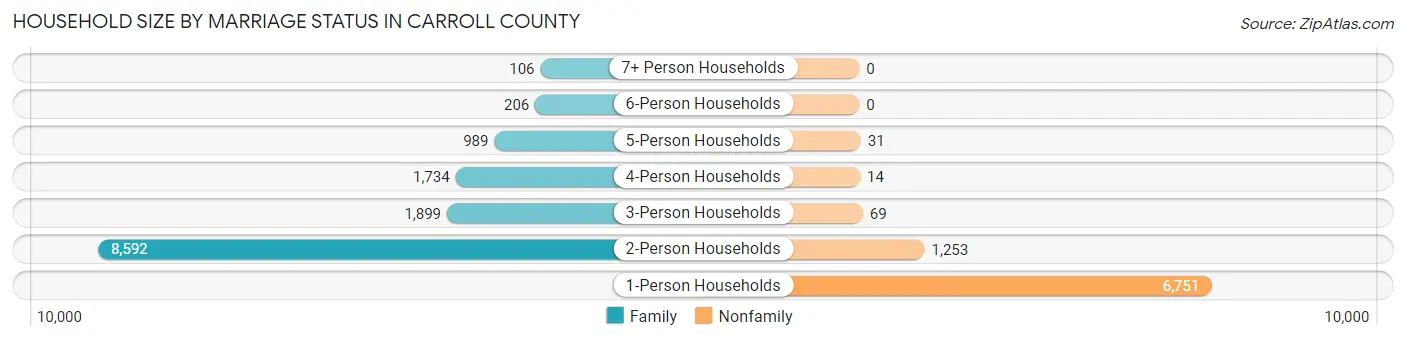
| Household Size | Family Households | Nonfamily Households |
| 1-Person Households | - | 6,751 (31.2%) |
| 2-Person Households | 8,592 (39.7%) | 1,253 (5.8%) |
| 3-Person Households | 1,899 (8.8%) | 69 (0.3%) |
| 4-Person Households | 1,734 (8.0%) | 14 (0.1%) |
| 5-Person Households | 989 (4.6%) | 31 (0.1%) |
| 6-Person Households | 206 (0.9%) | 0 (0.0%) |
| 7+ Person Households | 106 (0.5%) | 0 (0.0%) |
| Total | 13,526 (62.5%) | 8,118 (37.5%) |
Female Fertility in Carroll County
Fertility by Age in Carroll County
Average fertility rate in Carroll County is 27.0 births per 1,000 women. Women in the age bracket of 20 to 34 years have the highest fertility rate with 58.0 births per 1,000 women. Women in the age bracket of 20 to 34 years acount for 84.6% of all women with births.
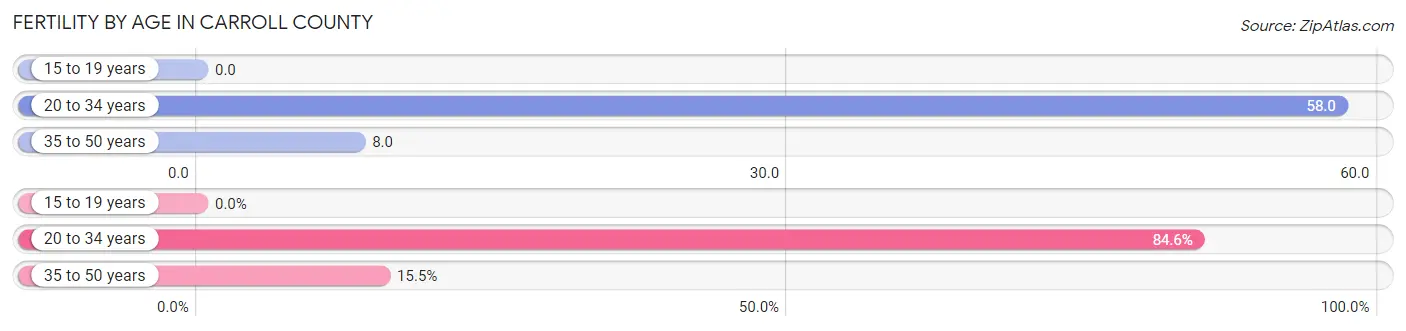
| Age Bracket | Women with Births | Births / 1,000 Women |
| 15 to 19 years | 0 (0.0%) | 0.0 |
| 20 to 34 years | 186 (84.6%) | 58.0 |
| 35 to 50 years | 34 (15.4%) | 8.0 |
| Total | 220 (100.0%) | 27.0 |
Fertility by Age by Marriage Status in Carroll County
73.2% of women with births (220) in Carroll County are married. The highest percentage of unmarried women with births falls into 20 to 34 years age bracket with 28.5% of them unmarried at the time of birth, while the lowest percentage of unmarried women with births belong to 35 to 50 years age bracket with 17.6% of them unmarried.
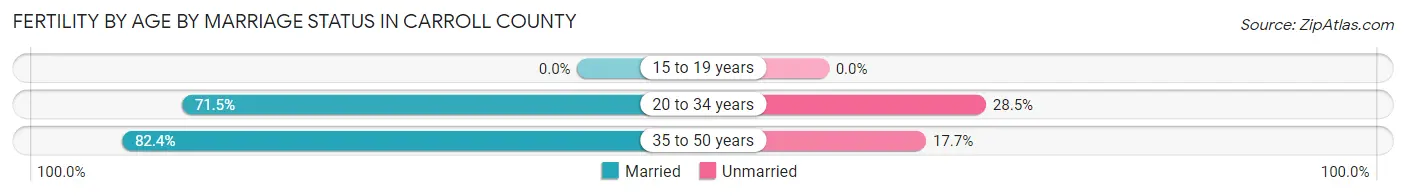
| Age Bracket | Married | Unmarried |
| 15 to 19 years | 0 (0.0%) | 0 (0.0%) |
| 20 to 34 years | 133 (71.5%) | 53 (28.5%) |
| 35 to 50 years | 28 (82.4%) | 6 (17.6%) |
| Total | 161 (73.2%) | 59 (26.8%) |
Fertility by Education in Carroll County
Average fertility rate in Carroll County is 27.0 births per 1,000 women. Women with the education attainment of bachelor's degree have the highest fertility rate of 63.0 births per 1,000 women, while women with the education attainment of less than high school have the lowest fertility at 4.0 births per 1,000 women. Women with the education attainment of bachelor's degree represent 42.7% of all women with births.
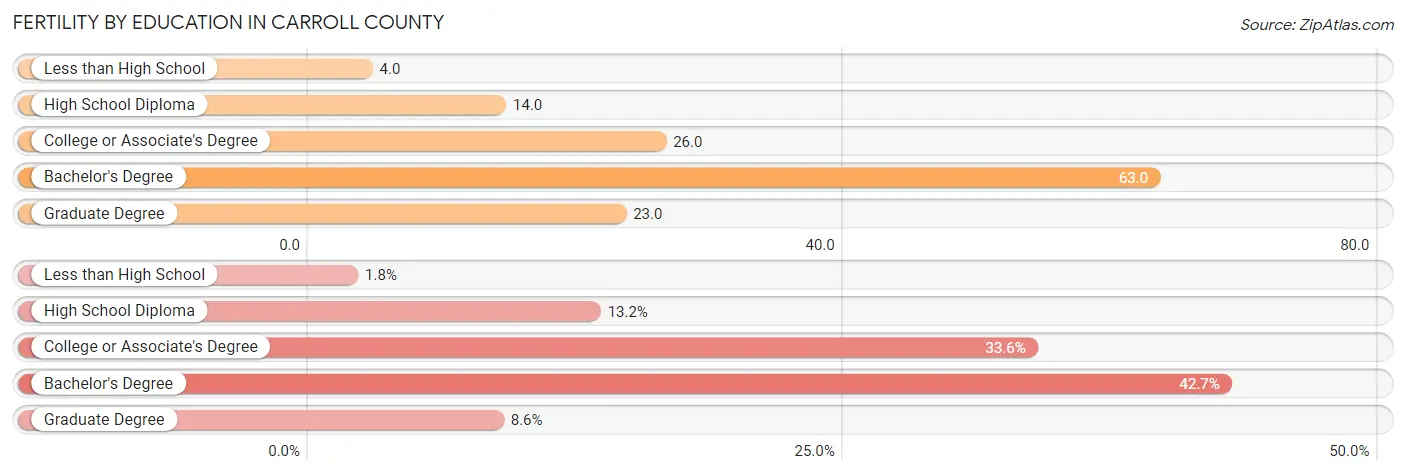
| Educational Attainment | Women with Births | Births / 1,000 Women |
| Less than High School | 4 (1.8%) | 4.0 |
| High School Diploma | 29 (13.2%) | 14.0 |
| College or Associate's Degree | 74 (33.6%) | 26.0 |
| Bachelor's Degree | 94 (42.7%) | 63.0 |
| Graduate Degree | 19 (8.6%) | 23.0 |
| Total | 220 (100.0%) | 27.0 |
Fertility by Education by Marriage Status in Carroll County
26.8% of women with births in Carroll County are unmarried. Women with the educational attainment of graduate degree are most likely to be married with 100.0% of them married at childbirth, while women with the educational attainment of less than high school are least likely to be married with 100.0% of them unmarried at childbirth.
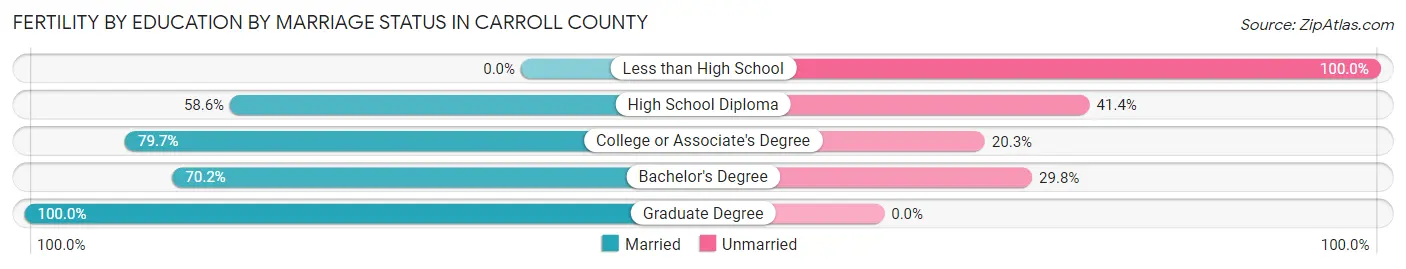
| Educational Attainment | Married | Unmarried |
| Less than High School | 0 (0.0%) | 4 (100.0%) |
| High School Diploma | 17 (58.6%) | 12 (41.4%) |
| College or Associate's Degree | 59 (79.7%) | 15 (20.3%) |
| Bachelor's Degree | 66 (70.2%) | 28 (29.8%) |
| Graduate Degree | 19 (100.0%) | 0 (0.0%) |
| Total | 161 (73.2%) | 59 (26.8%) |
Employment Characteristics in Carroll County
Employment by Class of Employer in Carroll County
Among the 24,419 employed individuals in Carroll County, private company employees (14,217 | 58.2%), self-employed (not incorporated) (2,682 | 11.0%), and not-for-profit organizations (2,666 | 10.9%) make up the most common classes of employment.
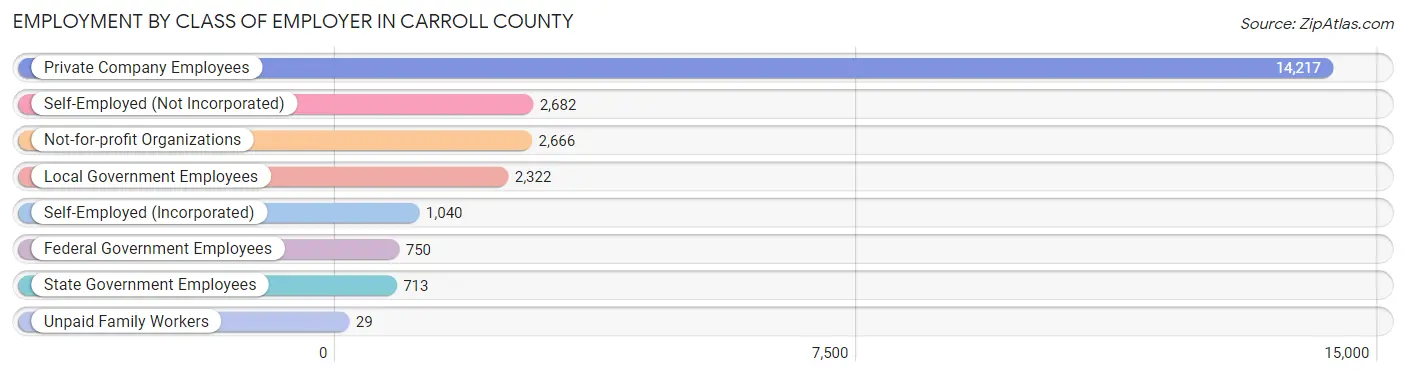
| Employer Class | # Employees | % Employees |
| Private Company Employees | 14,217 | 58.2% |
| Self-Employed (Incorporated) | 1,040 | 4.3% |
| Self-Employed (Not Incorporated) | 2,682 | 11.0% |
| Not-for-profit Organizations | 2,666 | 10.9% |
| Local Government Employees | 2,322 | 9.5% |
| State Government Employees | 713 | 2.9% |
| Federal Government Employees | 750 | 3.1% |
| Unpaid Family Workers | 29 | 0.1% |
| Total | 24,419 | 100.0% |
Employment Status by Age in Carroll County
According to the labor force statistics for Carroll County, out of the total population over 16 years of age (44,056), 59.8% or 26,345 individuals are in the labor force, with 5.6% or 1,475 of them unemployed. The age group with the highest labor force participation rate is 25 to 29 years, with 91.6% or 2,119 individuals in the labor force. Within the labor force, the 16 to 19 years age range has the highest percentage of unemployed individuals, with 21.4% or 232 of them being unemployed.
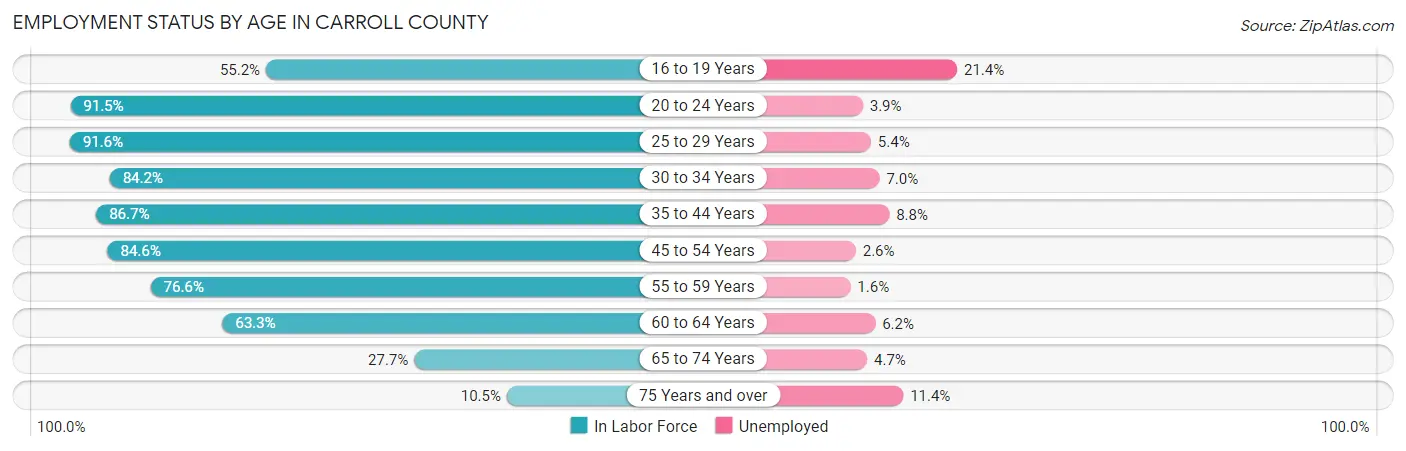
| Age Bracket | In Labor Force | Unemployed |
| 16 to 19 Years | 1,085 (55.2%) | 232 (21.4%) |
| 20 to 24 Years | 1,921 (91.5%) | 75 (3.9%) |
| 25 to 29 Years | 2,119 (91.6%) | 114 (5.4%) |
| 30 to 34 Years | 2,014 (84.2%) | 141 (7.0%) |
| 35 to 44 Years | 4,170 (86.7%) | 367 (8.8%) |
| 45 to 54 Years | 5,135 (84.6%) | 134 (2.6%) |
| 55 to 59 Years | 3,949 (76.6%) | 63 (1.6%) |
| 60 to 64 Years | 2,814 (63.3%) | 174 (6.2%) |
| 65 to 74 Years | 2,533 (27.7%) | 119 (4.7%) |
| 75 Years and over | 594 (10.5%) | 68 (11.4%) |
| Total | 26,345 (59.8%) | 1,475 (5.6%) |
Employment Status by Educational Attainment in Carroll County
According to labor force statistics for Carroll County, 80.2% of individuals (20,200) out of the total population between 25 and 64 years of age (25,187) are in the labor force, with 4.9% or 990 of them being unemployed. The group with the highest labor force participation rate are those with the educational attainment of high school diploma, with 83.0% or 6,019 individuals in the labor force. Within the labor force, individuals with less than high school education have the highest percentage of unemployment, with 7.9% or 53 of them being unemployed.
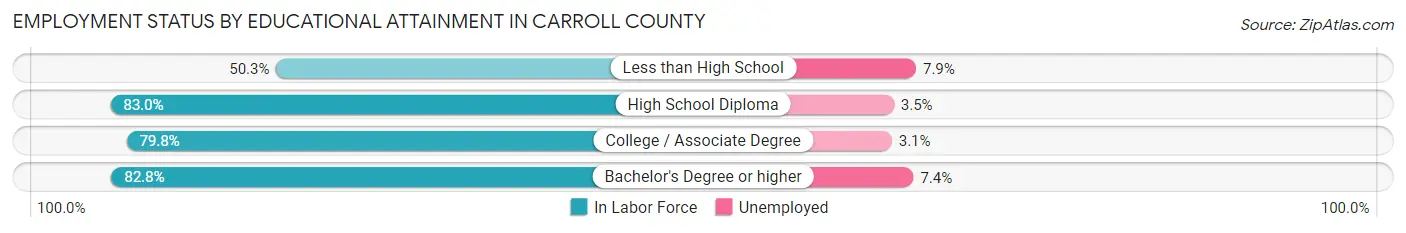
| Educational Attainment | In Labor Force | Unemployed |
| Less than High School | 672 (50.3%) | 105 (7.9%) |
| High School Diploma | 6,019 (83.0%) | 254 (3.5%) |
| College / Associate Degree | 6,266 (79.8%) | 243 (3.1%) |
| Bachelor's Degree or higher | 7,243 (82.8%) | 647 (7.4%) |
| Total | 20,200 (80.2%) | 1,234 (4.9%) |
Employment Occupations by Sex in Carroll County
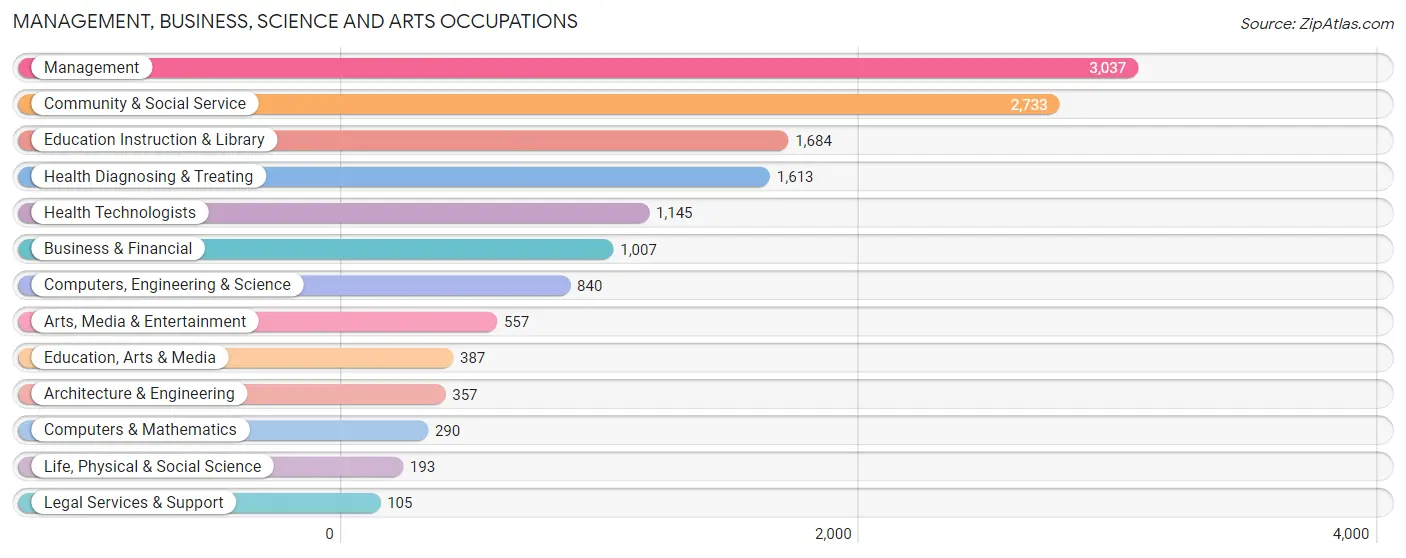
Management, Business, Science and Arts Occupations
The most common Management, Business, Science and Arts occupations in Carroll County are Management (3,037 | 12.2%), Community & Social Service (2,733 | 11.0%), Education Instruction & Library (1,684 | 6.8%), Health Diagnosing & Treating (1,613 | 6.5%), and Health Technologists (1,145 | 4.6%).
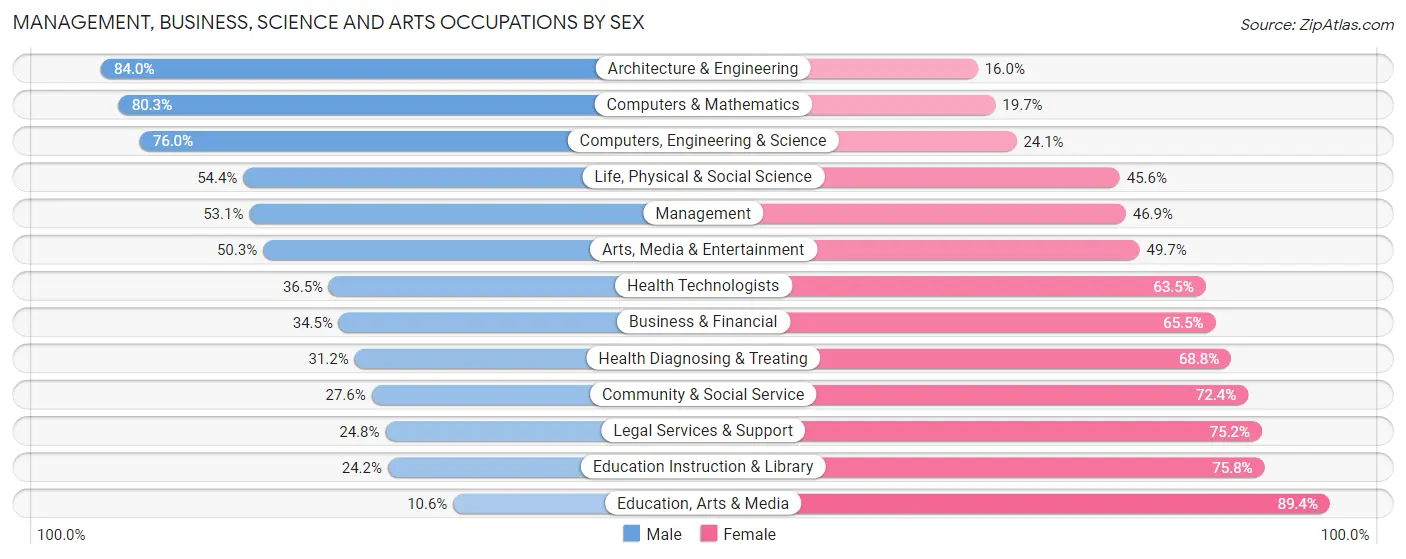
Management, Business, Science and Arts Occupations by Sex
Within the Management, Business, Science and Arts occupations in Carroll County, the most male-oriented occupations are Architecture & Engineering (84.0%), Computers & Mathematics (80.3%), and Computers, Engineering & Science (75.9%), while the most female-oriented occupations are Education, Arts & Media (89.4%), Education Instruction & Library (75.8%), and Legal Services & Support (75.2%).
| Occupation | Male | Female |
| Management | 1,614 (53.1%) | 1,423 (46.9%) |
| Business & Financial | 347 (34.5%) | 660 (65.5%) |
| Computers, Engineering & Science | 638 (75.9%) | 202 (24.0%) |
| Computers & Mathematics | 233 (80.3%) | 57 (19.7%) |
| Architecture & Engineering | 300 (84.0%) | 57 (16.0%) |
| Life, Physical & Social Science | 105 (54.4%) | 88 (45.6%) |
| Community & Social Service | 755 (27.6%) | 1,978 (72.4%) |
| Education, Arts & Media | 41 (10.6%) | 346 (89.4%) |
| Legal Services & Support | 26 (24.8%) | 79 (75.2%) |
| Education Instruction & Library | 408 (24.2%) | 1,276 (75.8%) |
| Arts, Media & Entertainment | 280 (50.3%) | 277 (49.7%) |
| Health Diagnosing & Treating | 503 (31.2%) | 1,110 (68.8%) |
| Health Technologists | 418 (36.5%) | 727 (63.5%) |
| Total (Category) | 3,857 (41.8%) | 5,373 (58.2%) |
| Total (Overall) | 12,985 (52.3%) | 11,848 (47.7%) |
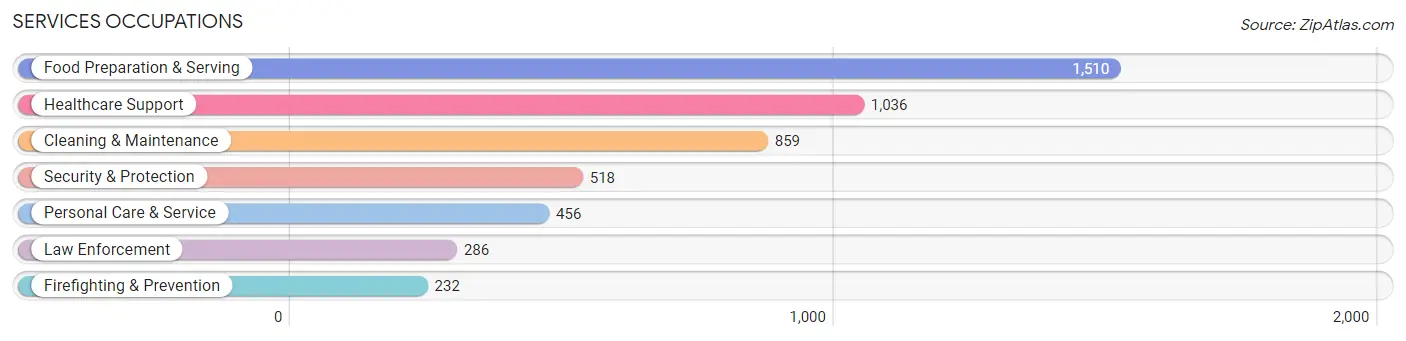
Services Occupations
The most common Services occupations in Carroll County are Food Preparation & Serving (1,510 | 6.1%), Healthcare Support (1,036 | 4.2%), Cleaning & Maintenance (859 | 3.5%), Security & Protection (518 | 2.1%), and Personal Care & Service (456 | 1.8%).
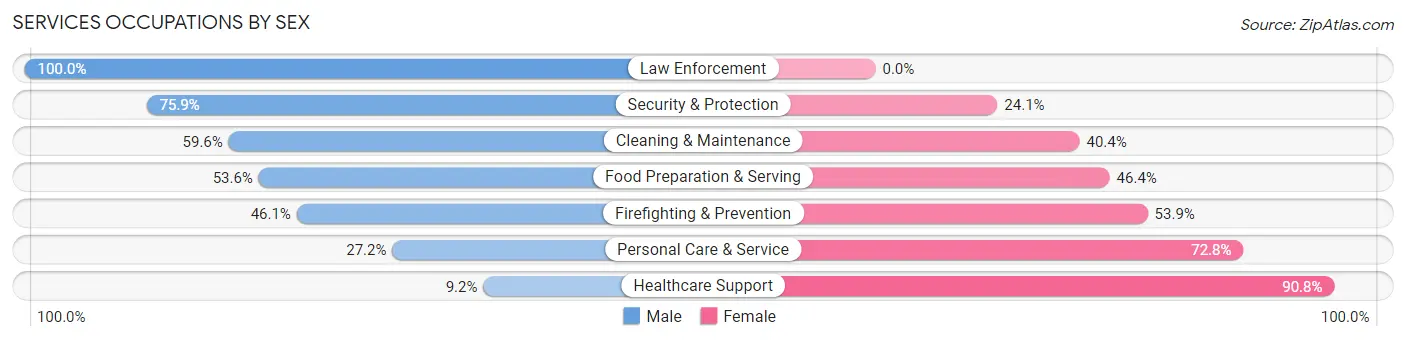
Services Occupations by Sex
Within the Services occupations in Carroll County, the most male-oriented occupations are Law Enforcement (100.0%), Security & Protection (75.9%), and Cleaning & Maintenance (59.6%), while the most female-oriented occupations are Healthcare Support (90.8%), Personal Care & Service (72.8%), and Firefighting & Prevention (53.9%).
| Occupation | Male | Female |
| Healthcare Support | 95 (9.2%) | 941 (90.8%) |
| Security & Protection | 393 (75.9%) | 125 (24.1%) |
| Firefighting & Prevention | 107 (46.1%) | 125 (53.9%) |
| Law Enforcement | 286 (100.0%) | 0 (0.0%) |
| Food Preparation & Serving | 810 (53.6%) | 700 (46.4%) |
| Cleaning & Maintenance | 512 (59.6%) | 347 (40.4%) |
| Personal Care & Service | 124 (27.2%) | 332 (72.8%) |
| Total (Category) | 1,934 (44.2%) | 2,445 (55.8%) |
| Total (Overall) | 12,985 (52.3%) | 11,848 (47.7%) |
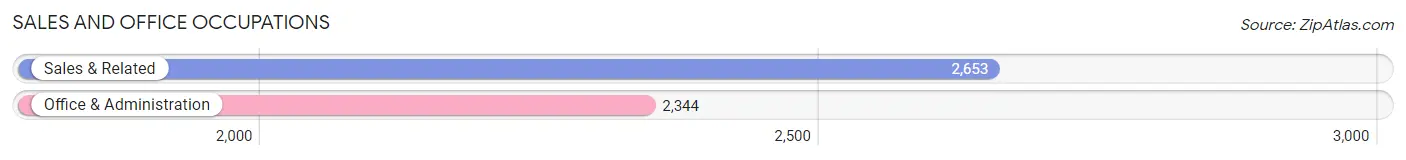
Sales and Office Occupations
The most common Sales and Office occupations in Carroll County are Sales & Related (2,653 | 10.7%), and Office & Administration (2,344 | 9.4%).
Sales and Office Occupations by Sex
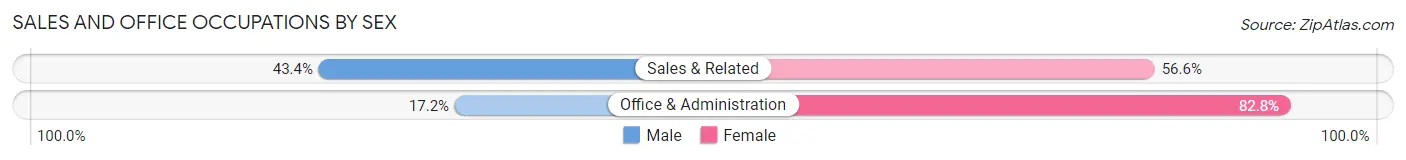
| Occupation | Male | Female |
| Sales & Related | 1,152 (43.4%) | 1,501 (56.6%) |
| Office & Administration | 404 (17.2%) | 1,940 (82.8%) |
| Total (Category) | 1,556 (31.1%) | 3,441 (68.9%) |
| Total (Overall) | 12,985 (52.3%) | 11,848 (47.7%) |
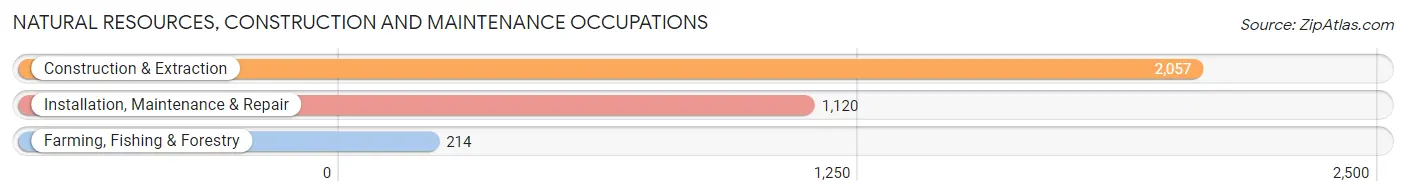
Natural Resources, Construction and Maintenance Occupations
The most common Natural Resources, Construction and Maintenance occupations in Carroll County are Construction & Extraction (2,057 | 8.3%), Installation, Maintenance & Repair (1,120 | 4.5%), and Farming, Fishing & Forestry (214 | 0.9%).
Natural Resources, Construction and Maintenance Occupations by Sex
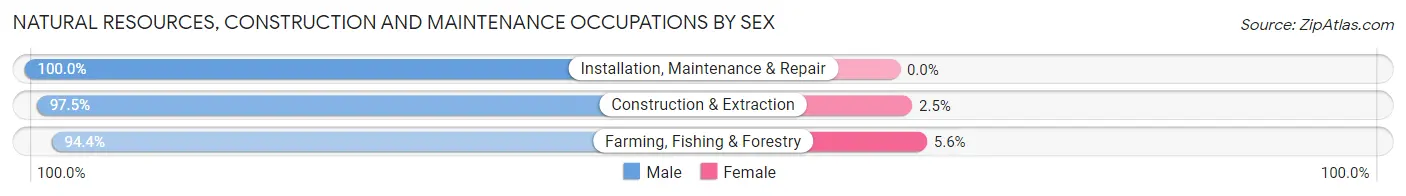
| Occupation | Male | Female |
| Farming, Fishing & Forestry | 202 (94.4%) | 12 (5.6%) |
| Construction & Extraction | 2,005 (97.5%) | 52 (2.5%) |
| Installation, Maintenance & Repair | 1,120 (100.0%) | 0 (0.0%) |
| Total (Category) | 3,327 (98.1%) | 64 (1.9%) |
| Total (Overall) | 12,985 (52.3%) | 11,848 (47.7%) |
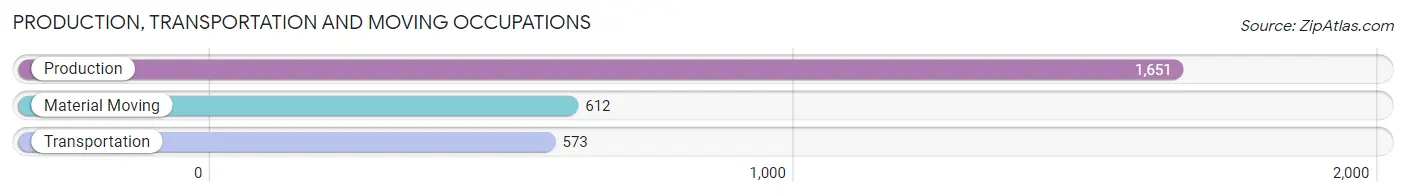
Production, Transportation and Moving Occupations
The most common Production, Transportation and Moving occupations in Carroll County are Production (1,651 | 6.7%), Material Moving (612 | 2.5%), and Transportation (573 | 2.3%).
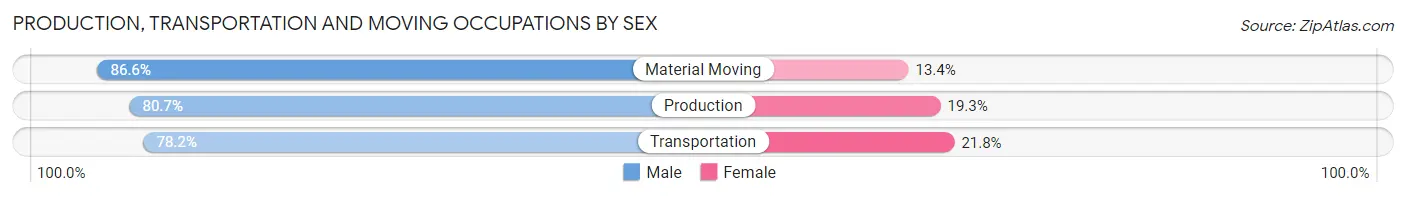
Production, Transportation and Moving Occupations by Sex
| Occupation | Male | Female |
| Production | 1,333 (80.7%) | 318 (19.3%) |
| Transportation | 448 (78.2%) | 125 (21.8%) |
| Material Moving | 530 (86.6%) | 82 (13.4%) |
| Total (Category) | 2,311 (81.5%) | 525 (18.5%) |
| Total (Overall) | 12,985 (52.3%) | 11,848 (47.7%) |
Employment Industries by Sex in Carroll County
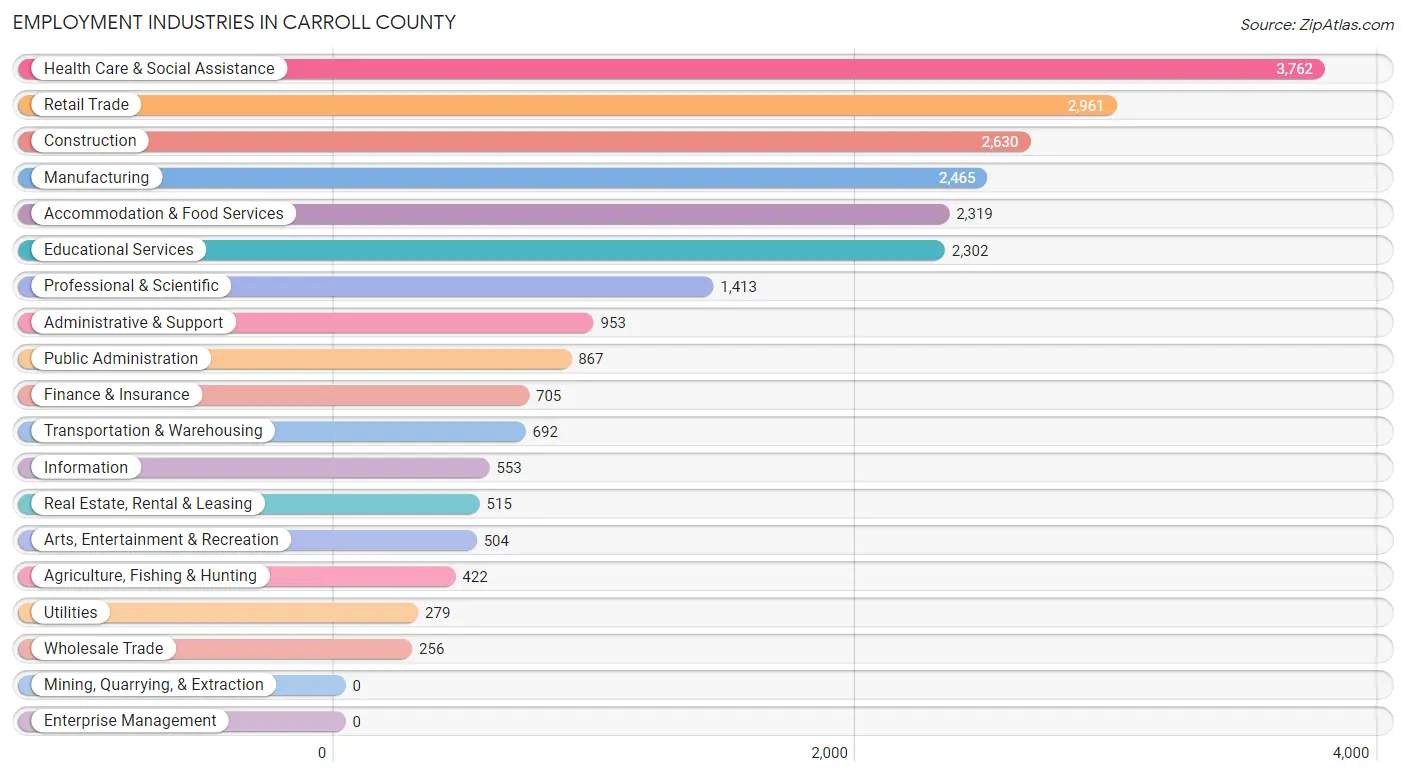
Employment Industries in Carroll County
The major employment industries in Carroll County include Health Care & Social Assistance (3,762 | 15.1%), Retail Trade (2,961 | 11.9%), Construction (2,630 | 10.6%), Manufacturing (2,465 | 9.9%), and Accommodation & Food Services (2,319 | 9.3%).
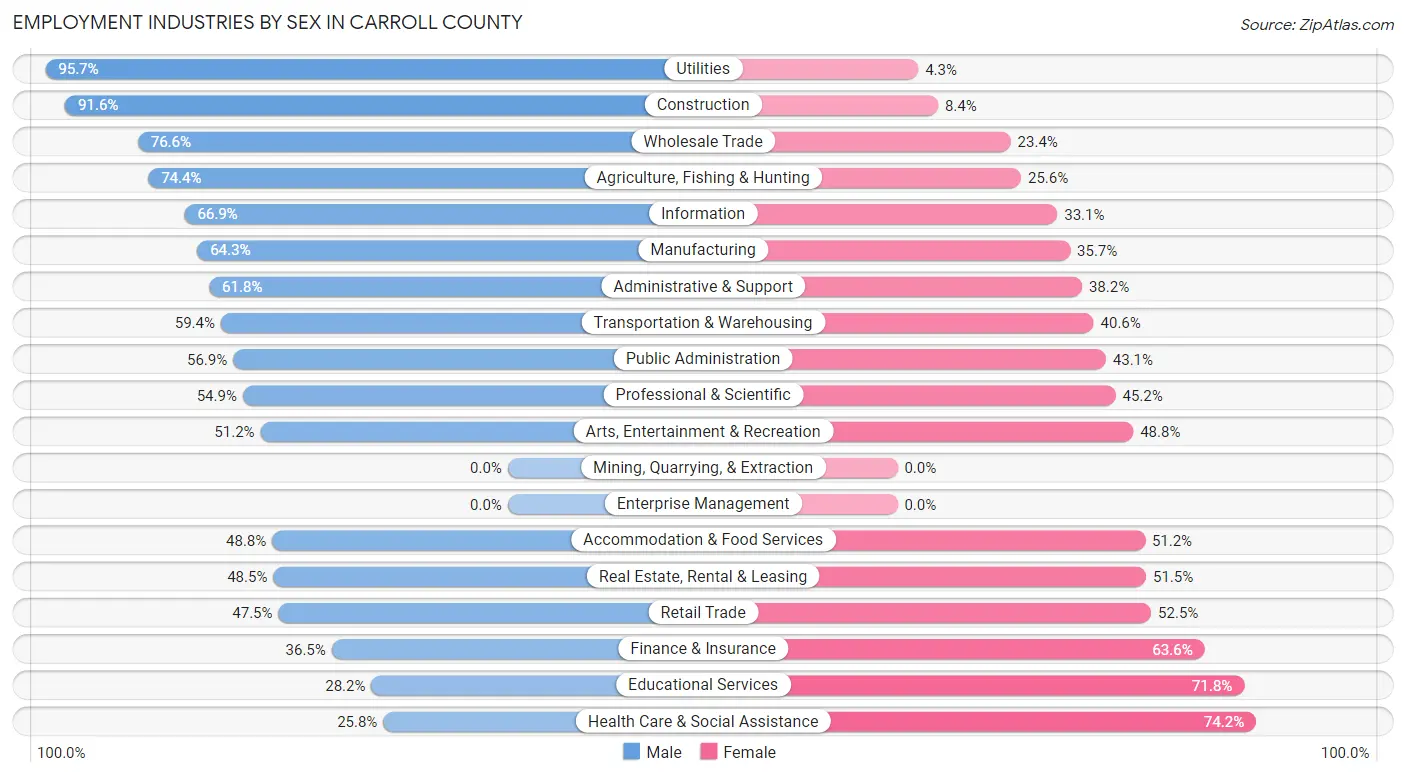
Employment Industries by Sex in Carroll County
The Carroll County industries that see more men than women are Utilities (95.7%), Construction (91.6%), and Wholesale Trade (76.6%), whereas the industries that tend to have a higher number of women are Health Care & Social Assistance (74.2%), Educational Services (71.8%), and Finance & Insurance (63.5%).
| Industry | Male | Female |
| Agriculture, Fishing & Hunting | 314 (74.4%) | 108 (25.6%) |
| Mining, Quarrying, & Extraction | 0 (0.0%) | 0 (0.0%) |
| Construction | 2,409 (91.6%) | 221 (8.4%) |
| Manufacturing | 1,584 (64.3%) | 881 (35.7%) |
| Wholesale Trade | 196 (76.6%) | 60 (23.4%) |
| Retail Trade | 1,406 (47.5%) | 1,555 (52.5%) |
| Transportation & Warehousing | 411 (59.4%) | 281 (40.6%) |
| Utilities | 267 (95.7%) | 12 (4.3%) |
| Information | 370 (66.9%) | 183 (33.1%) |
| Finance & Insurance | 257 (36.4%) | 448 (63.5%) |
| Real Estate, Rental & Leasing | 250 (48.5%) | 265 (51.5%) |
| Professional & Scientific | 775 (54.8%) | 638 (45.2%) |
| Enterprise Management | 0 (0.0%) | 0 (0.0%) |
| Administrative & Support | 589 (61.8%) | 364 (38.2%) |
| Educational Services | 650 (28.2%) | 1,652 (71.8%) |
| Health Care & Social Assistance | 970 (25.8%) | 2,792 (74.2%) |
| Arts, Entertainment & Recreation | 258 (51.2%) | 246 (48.8%) |
| Accommodation & Food Services | 1,131 (48.8%) | 1,188 (51.2%) |
| Public Administration | 493 (56.9%) | 374 (43.1%) |
| Total | 12,985 (52.3%) | 11,848 (47.7%) |
Education in Carroll County
School Enrollment in Carroll County
The most common levels of schooling among the 8,341 students in Carroll County are high school (1,980 | 23.7%), middle school (1,905 | 22.8%), and elementary school (1,678 | 20.1%).
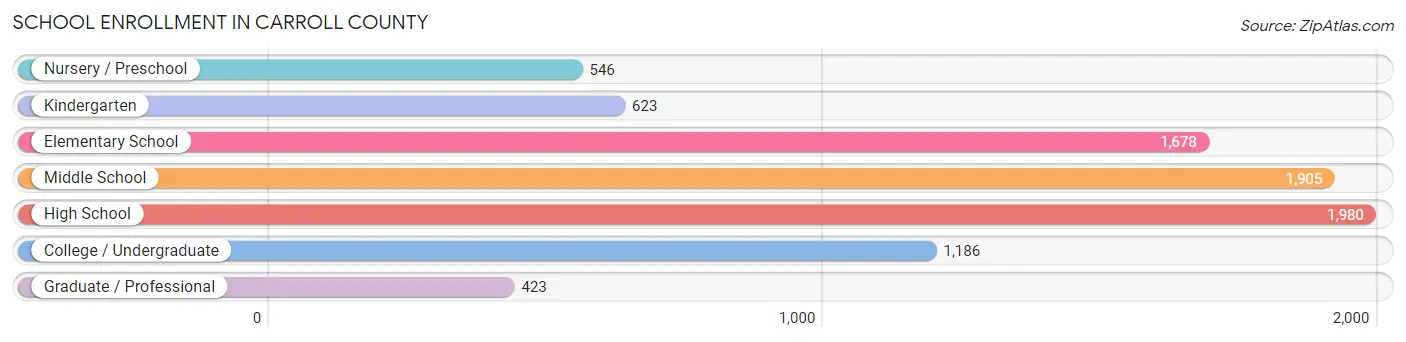
| School Level | # Students | % Students |
| Nursery / Preschool | 546 | 6.6% |
| Kindergarten | 623 | 7.5% |
| Elementary School | 1,678 | 20.1% |
| Middle School | 1,905 | 22.8% |
| High School | 1,980 | 23.7% |
| College / Undergraduate | 1,186 | 14.2% |
| Graduate / Professional | 423 | 5.1% |
| Total | 8,341 | 100.0% |
School Enrollment by Age by Funding Source in Carroll County
Out of a total of 8,341 students who are enrolled in schools in Carroll County, 1,360 (16.3%) attend a private institution, while the remaining 6,981 (83.7%) are enrolled in public schools. The age group of 3 to 4 year olds has the highest likelihood of being enrolled in private schools, with 244 (50.7% in the age bracket) enrolled. Conversely, the age group of 10 to 14 year olds has the lowest likelihood of being enrolled in a private school, with 2,138 (92.2% in the age bracket) attending a public institution.
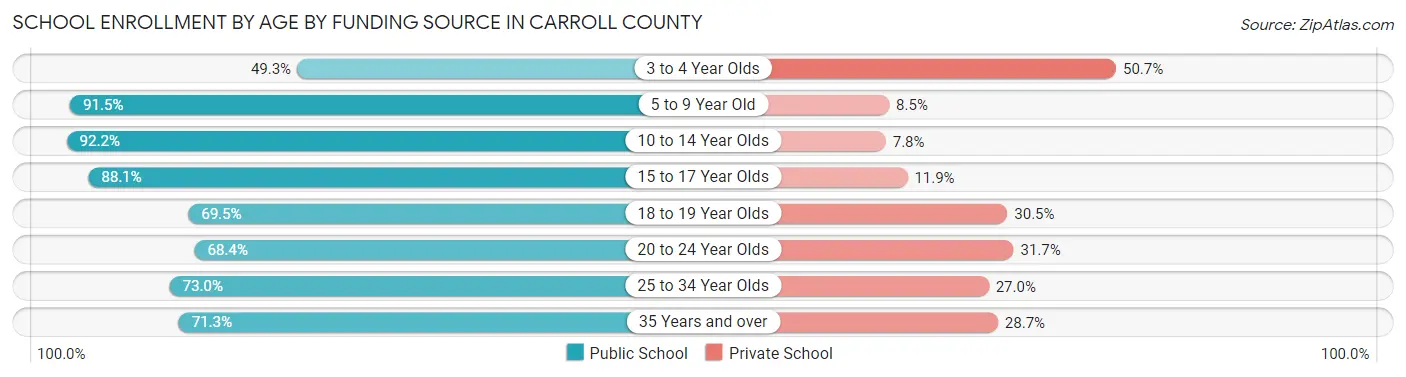
| Age Bracket | Public School | Private School |
| 3 to 4 Year Olds | 237 (49.3%) | 244 (50.7%) |
| 5 to 9 Year Old | 1,956 (91.5%) | 181 (8.5%) |
| 10 to 14 Year Olds | 2,138 (92.2%) | 182 (7.8%) |
| 15 to 17 Year Olds | 1,276 (88.1%) | 172 (11.9%) |
| 18 to 19 Year Olds | 326 (69.5%) | 143 (30.5%) |
| 20 to 24 Year Olds | 406 (68.3%) | 188 (31.7%) |
| 25 to 34 Year Olds | 181 (73.0%) | 67 (27.0%) |
| 35 Years and over | 459 (71.3%) | 185 (28.7%) |
| Total | 6,981 (83.7%) | 1,360 (16.3%) |
Educational Attainment by Field of Study in Carroll County
Business (2,512 | 15.7%), education (2,337 | 14.6%), science & technology (1,531 | 9.6%), social sciences (1,401 | 8.8%), and literature & languages (1,385 | 8.7%) are the most common fields of study among 15,997 individuals in Carroll County who have obtained a bachelor's degree or higher.
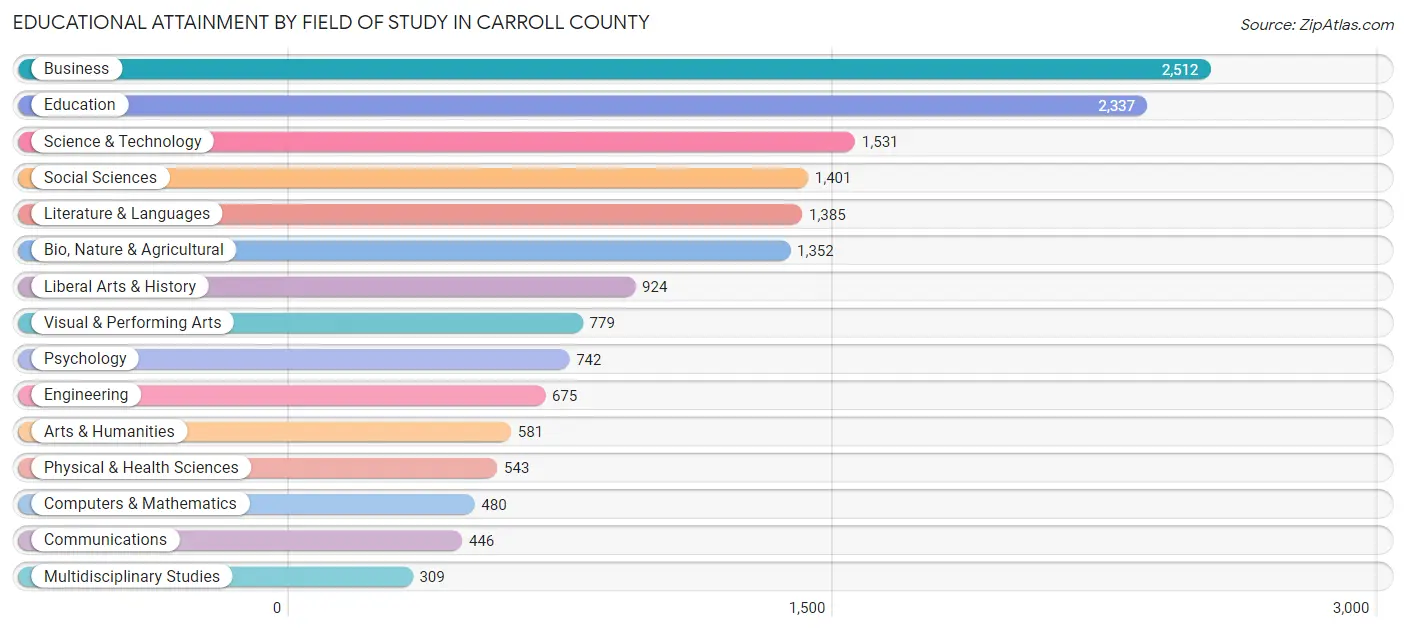
| Field of Study | # Graduates | % Graduates |
| Computers & Mathematics | 480 | 3.0% |
| Bio, Nature & Agricultural | 1,352 | 8.5% |
| Physical & Health Sciences | 543 | 3.4% |
| Psychology | 742 | 4.6% |
| Social Sciences | 1,401 | 8.8% |
| Engineering | 675 | 4.2% |
| Multidisciplinary Studies | 309 | 1.9% |
| Science & Technology | 1,531 | 9.6% |
| Business | 2,512 | 15.7% |
| Education | 2,337 | 14.6% |
| Literature & Languages | 1,385 | 8.7% |
| Liberal Arts & History | 924 | 5.8% |
| Visual & Performing Arts | 779 | 4.9% |
| Communications | 446 | 2.8% |
| Arts & Humanities | 581 | 3.6% |
| Total | 15,997 | 100.0% |
Transportation & Commute in Carroll County
Vehicle Availability by Sex in Carroll County
The most prevalent vehicle ownership categories in Carroll County are males with 2 vehicles (5,110, accounting for 40.0%) and females with 2 vehicles (4,089, making up 43.9%).
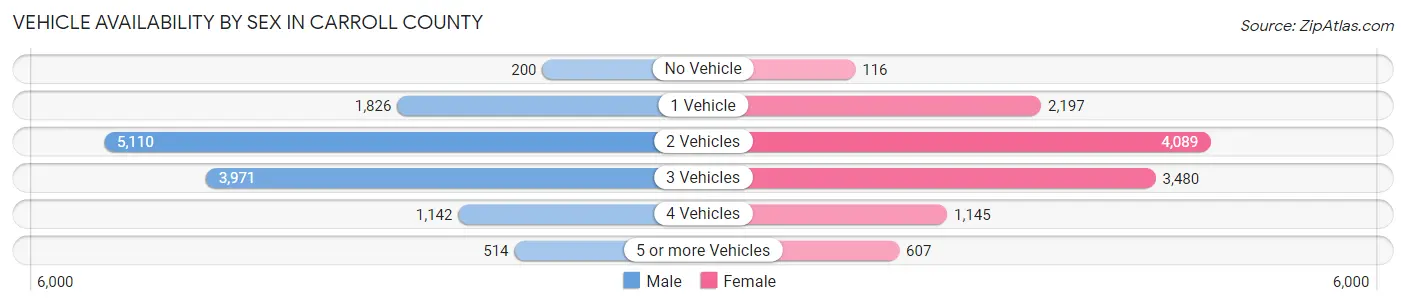
| Vehicles Available | Male | Female |
| No Vehicle | 200 (1.6%) | 116 (1.0%) |
| 1 Vehicle | 1,826 (14.3%) | 2,197 (18.9%) |
| 2 Vehicles | 5,110 (40.0%) | 4,089 (35.1%) |
| 3 Vehicles | 3,971 (31.1%) | 3,480 (29.9%) |
| 4 Vehicles | 1,142 (8.9%) | 1,145 (9.8%) |
| 5 or more Vehicles | 514 (4.0%) | 607 (5.2%) |
| Total | 12,763 (100.0%) | 11,634 (100.0%) |
Commute Time in Carroll County
The most frequently occuring commute durations in Carroll County are 10 to 14 minutes (3,556 commuters, 16.6%), 20 to 24 minutes (2,615 commuters, 12.2%), and 5 to 9 minutes (2,592 commuters, 12.1%).
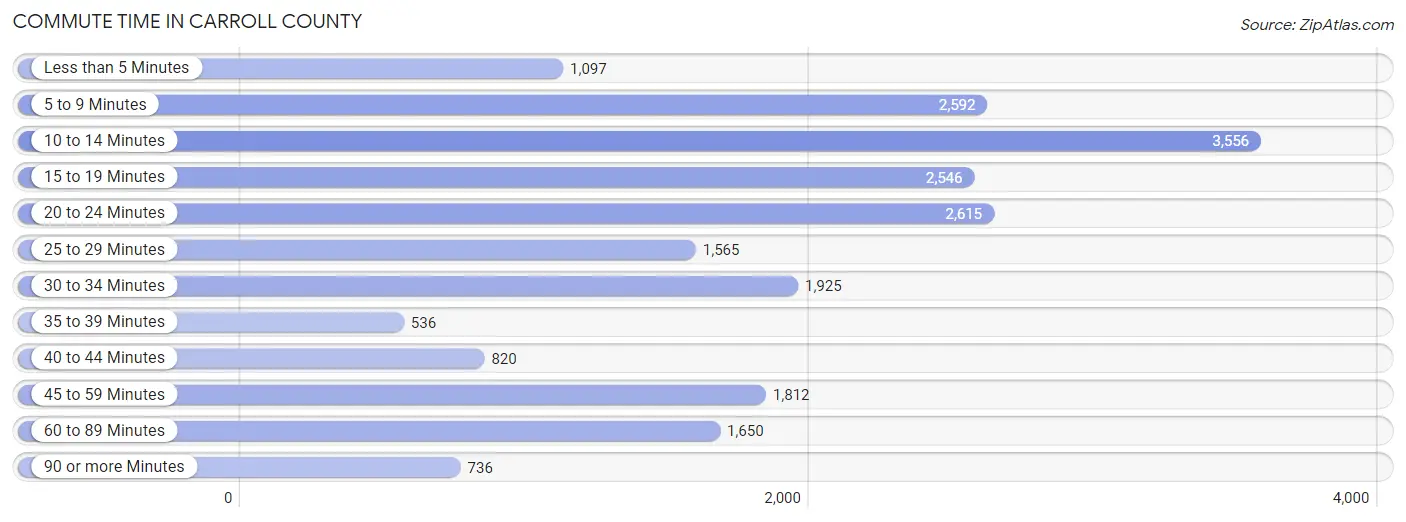
| Commute Time | # Commuters | % Commuters |
| Less than 5 Minutes | 1,097 | 5.1% |
| 5 to 9 Minutes | 2,592 | 12.1% |
| 10 to 14 Minutes | 3,556 | 16.6% |
| 15 to 19 Minutes | 2,546 | 11.9% |
| 20 to 24 Minutes | 2,615 | 12.2% |
| 25 to 29 Minutes | 1,565 | 7.3% |
| 30 to 34 Minutes | 1,925 | 9.0% |
| 35 to 39 Minutes | 536 | 2.5% |
| 40 to 44 Minutes | 820 | 3.8% |
| 45 to 59 Minutes | 1,812 | 8.5% |
| 60 to 89 Minutes | 1,650 | 7.7% |
| 90 or more Minutes | 736 | 3.4% |
Commute Time by Sex in Carroll County
The most common commute times in Carroll County are 10 to 14 minutes (2,032 commuters, 17.9%) for males and 5 to 9 minutes (1,565 commuters, 15.5%) for females.
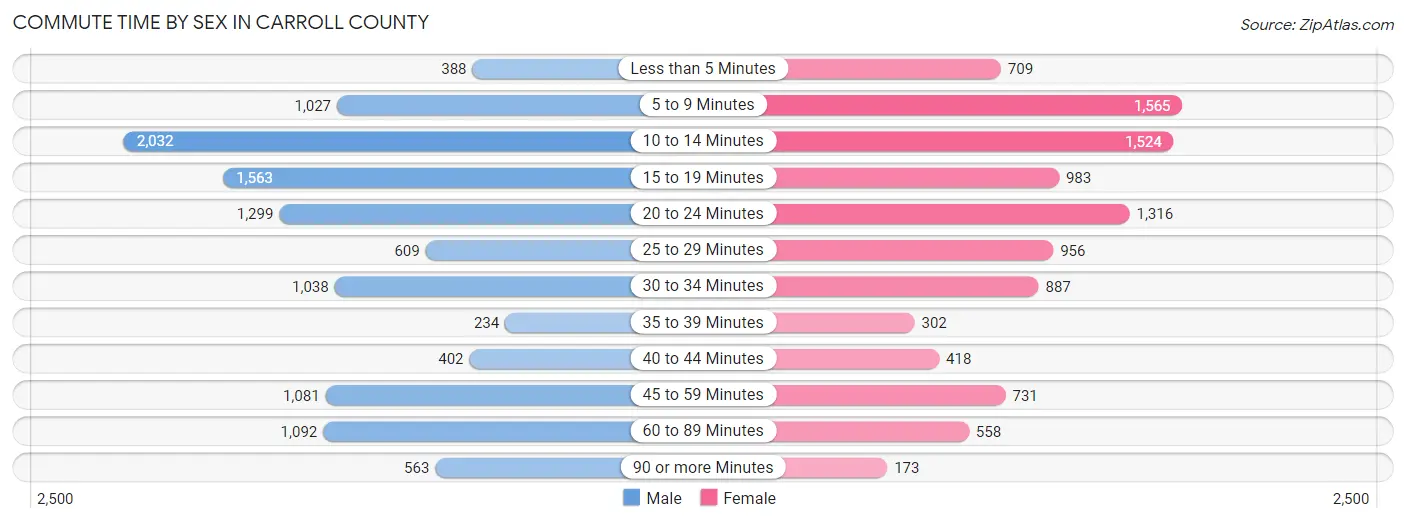
| Commute Time | Male | Female |
| Less than 5 Minutes | 388 (3.4%) | 709 (7.0%) |
| 5 to 9 Minutes | 1,027 (9.1%) | 1,565 (15.5%) |
| 10 to 14 Minutes | 2,032 (17.9%) | 1,524 (15.1%) |
| 15 to 19 Minutes | 1,563 (13.8%) | 983 (9.7%) |
| 20 to 24 Minutes | 1,299 (11.5%) | 1,316 (13.0%) |
| 25 to 29 Minutes | 609 (5.4%) | 956 (9.4%) |
| 30 to 34 Minutes | 1,038 (9.2%) | 887 (8.8%) |
| 35 to 39 Minutes | 234 (2.1%) | 302 (3.0%) |
| 40 to 44 Minutes | 402 (3.5%) | 418 (4.1%) |
| 45 to 59 Minutes | 1,081 (9.5%) | 731 (7.2%) |
| 60 to 89 Minutes | 1,092 (9.6%) | 558 (5.5%) |
| 90 or more Minutes | 563 (5.0%) | 173 (1.7%) |
Time of Departure to Work by Sex in Carroll County
The most frequent times of departure to work in Carroll County are 7:00 AM to 7:29 AM (1,662, 14.7%) for males and 7:00 AM to 7:29 AM (1,595, 15.8%) for females.
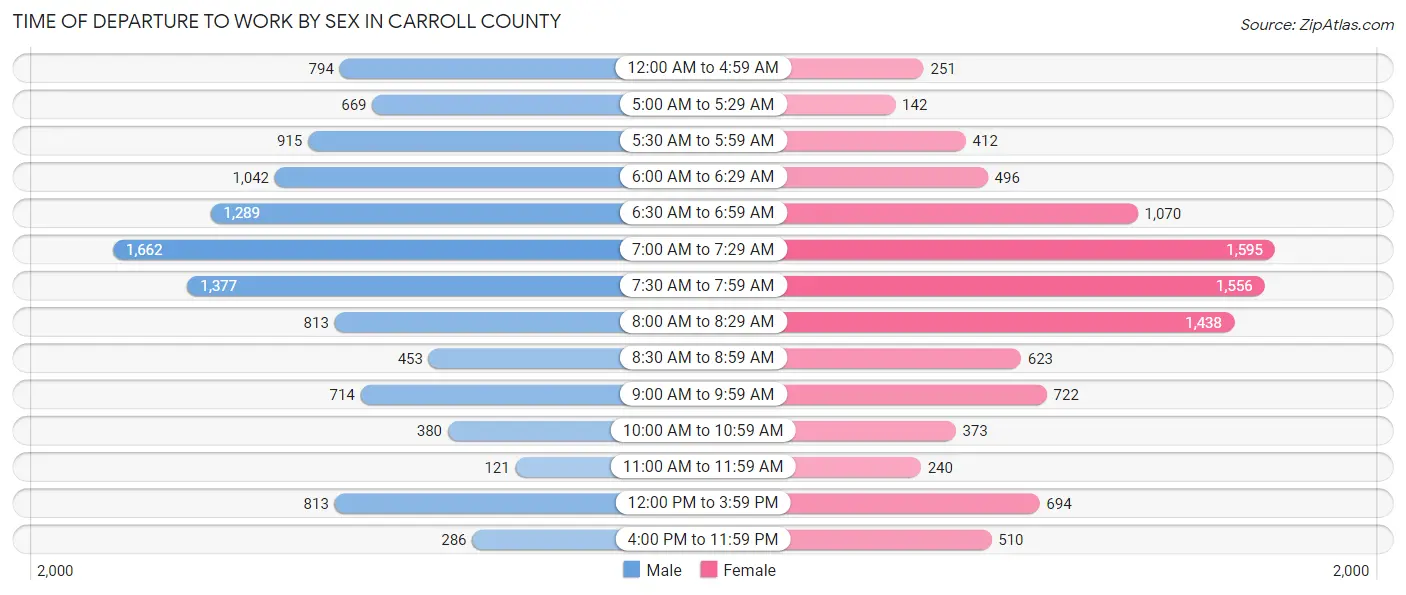
| Time of Departure | Male | Female |
| 12:00 AM to 4:59 AM | 794 (7.0%) | 251 (2.5%) |
| 5:00 AM to 5:29 AM | 669 (5.9%) | 142 (1.4%) |
| 5:30 AM to 5:59 AM | 915 (8.1%) | 412 (4.1%) |
| 6:00 AM to 6:29 AM | 1,042 (9.2%) | 496 (4.9%) |
| 6:30 AM to 6:59 AM | 1,289 (11.4%) | 1,070 (10.6%) |
| 7:00 AM to 7:29 AM | 1,662 (14.7%) | 1,595 (15.8%) |
| 7:30 AM to 7:59 AM | 1,377 (12.2%) | 1,556 (15.4%) |
| 8:00 AM to 8:29 AM | 813 (7.2%) | 1,438 (14.2%) |
| 8:30 AM to 8:59 AM | 453 (4.0%) | 623 (6.1%) |
| 9:00 AM to 9:59 AM | 714 (6.3%) | 722 (7.1%) |
| 10:00 AM to 10:59 AM | 380 (3.4%) | 373 (3.7%) |
| 11:00 AM to 11:59 AM | 121 (1.1%) | 240 (2.4%) |
| 12:00 PM to 3:59 PM | 813 (7.2%) | 694 (6.9%) |
| 4:00 PM to 11:59 PM | 286 (2.5%) | 510 (5.0%) |
| Total | 11,328 (100.0%) | 10,122 (100.0%) |
Housing Occupancy in Carroll County
Occupancy by Ownership in Carroll County
Of the total 21,644 dwellings in Carroll County, owner-occupied units account for 17,650 (81.6%), while renter-occupied units make up 3,994 (18.4%).
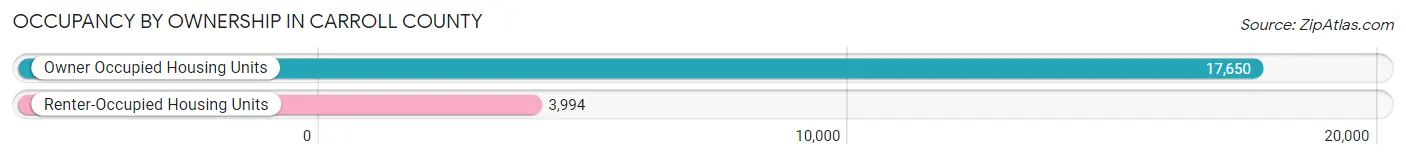
| Occupancy | # Housing Units | % Housing Units |
| Owner Occupied Housing Units | 17,650 | 81.6% |
| Renter-Occupied Housing Units | 3,994 | 18.4% |
| Total Occupied Housing Units | 21,644 | 100.0% |
Occupancy by Household Size in Carroll County
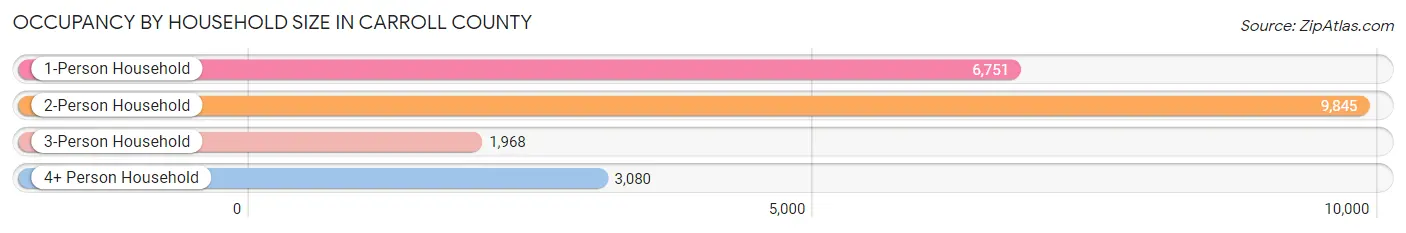
| Household Size | # Housing Units | % Housing Units |
| 1-Person Household | 6,751 | 31.2% |
| 2-Person Household | 9,845 | 45.5% |
| 3-Person Household | 1,968 | 9.1% |
| 4+ Person Household | 3,080 | 14.2% |
| Total Housing Units | 21,644 | 100.0% |
Occupancy by Ownership by Household Size in Carroll County
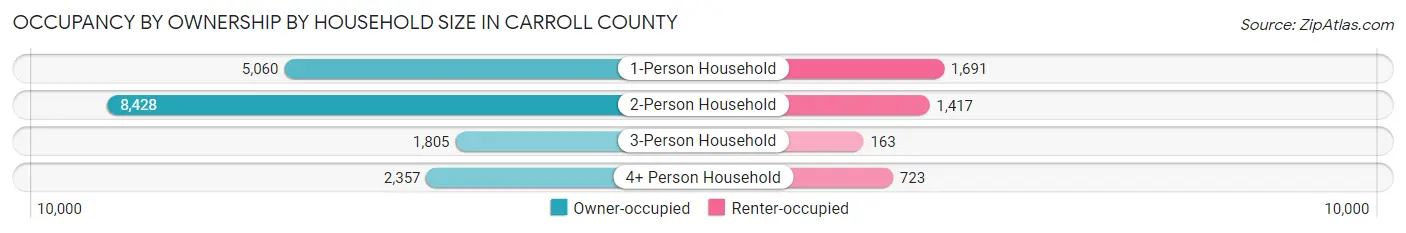
| Household Size | Owner-occupied | Renter-occupied |
| 1-Person Household | 5,060 (75.0%) | 1,691 (25.1%) |
| 2-Person Household | 8,428 (85.6%) | 1,417 (14.4%) |
| 3-Person Household | 1,805 (91.7%) | 163 (8.3%) |
| 4+ Person Household | 2,357 (76.5%) | 723 (23.5%) |
| Total Housing Units | 17,650 (81.6%) | 3,994 (18.4%) |
Occupancy by Educational Attainment in Carroll County
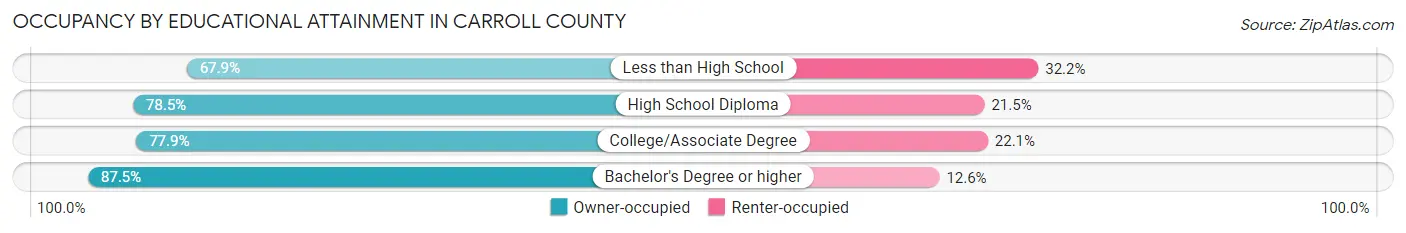
| Household Size | Owner-occupied | Renter-occupied |
| Less than High School | 610 (67.8%) | 289 (32.2%) |
| High School Diploma | 3,565 (78.5%) | 975 (21.5%) |
| College/Associate Degree | 5,650 (77.9%) | 1,607 (22.1%) |
| Bachelor's Degree or higher | 7,825 (87.5%) | 1,123 (12.6%) |
Occupancy by Age of Householder in Carroll County
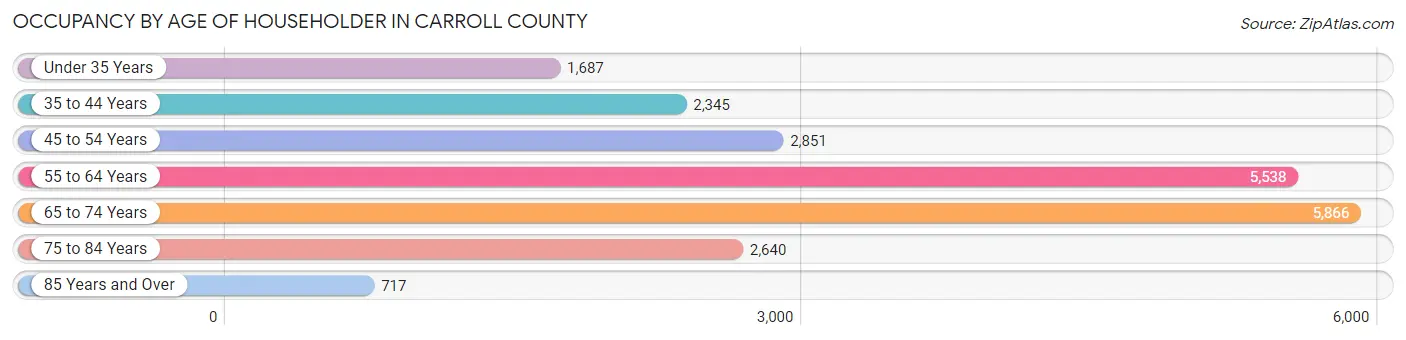
| Age Bracket | # Households | % Households |
| Under 35 Years | 1,687 | 7.8% |
| 35 to 44 Years | 2,345 | 10.8% |
| 45 to 54 Years | 2,851 | 13.2% |
| 55 to 64 Years | 5,538 | 25.6% |
| 65 to 74 Years | 5,866 | 27.1% |
| 75 to 84 Years | 2,640 | 12.2% |
| 85 Years and Over | 717 | 3.3% |
| Total | 21,644 | 100.0% |
Housing Finances in Carroll County
Median Income by Occupancy in Carroll County
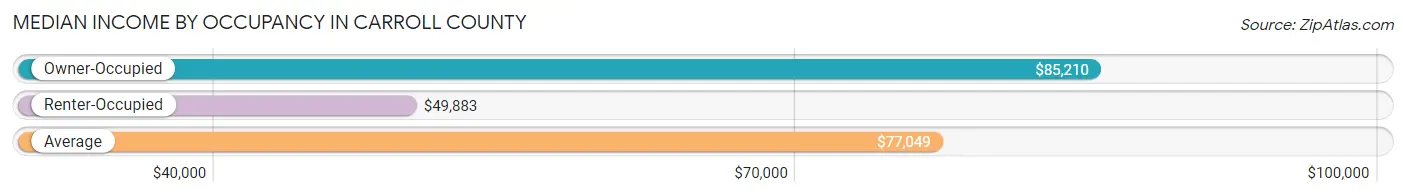
| Occupancy Type | # Households | Median Income |
| Owner-Occupied | 17,650 (81.6%) | $85,210 |
| Renter-Occupied | 3,994 (18.4%) | $49,883 |
| Average | 21,644 (100.0%) | $77,049 |
Occupancy by Householder Income Bracket in Carroll County
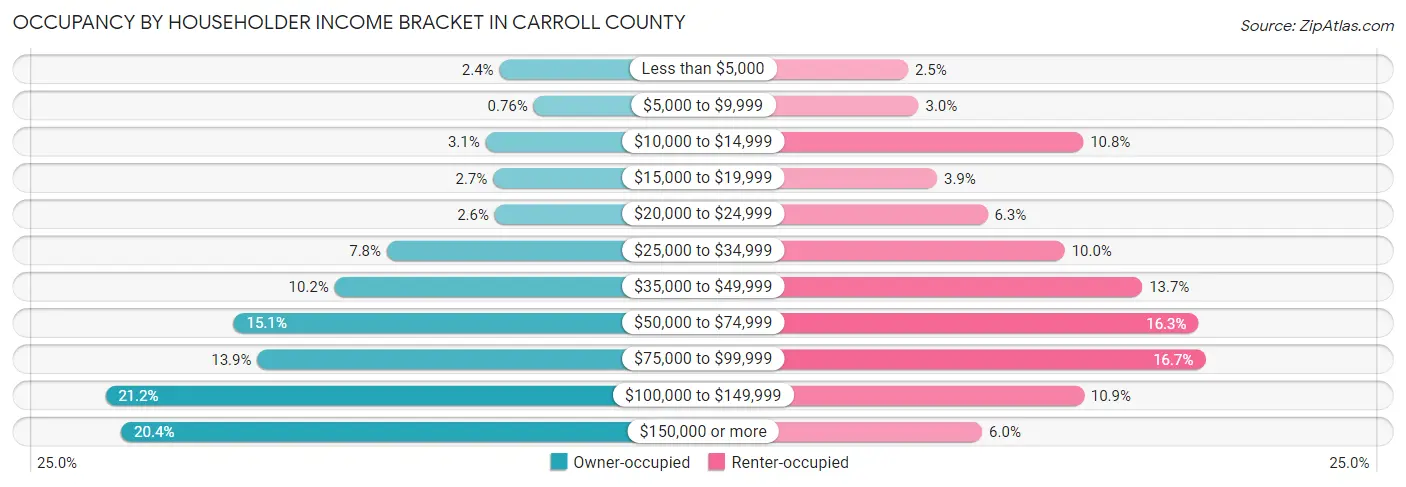
| Income Bracket | Owner-occupied | Renter-occupied |
| Less than $5,000 | 421 (2.4%) | 100 (2.5%) |
| $5,000 to $9,999 | 134 (0.8%) | 120 (3.0%) |
| $10,000 to $14,999 | 539 (3.0%) | 433 (10.8%) |
| $15,000 to $19,999 | 474 (2.7%) | 155 (3.9%) |
| $20,000 to $24,999 | 460 (2.6%) | 251 (6.3%) |
| $25,000 to $34,999 | 1,367 (7.7%) | 398 (10.0%) |
| $35,000 to $49,999 | 1,807 (10.2%) | 545 (13.7%) |
| $50,000 to $74,999 | 2,657 (15.0%) | 652 (16.3%) |
| $75,000 to $99,999 | 2,456 (13.9%) | 665 (16.7%) |
| $100,000 to $149,999 | 3,735 (21.2%) | 434 (10.9%) |
| $150,000 or more | 3,600 (20.4%) | 241 (6.0%) |
| Total | 17,650 (100.0%) | 3,994 (100.0%) |
Monthly Housing Cost Tiers in Carroll County
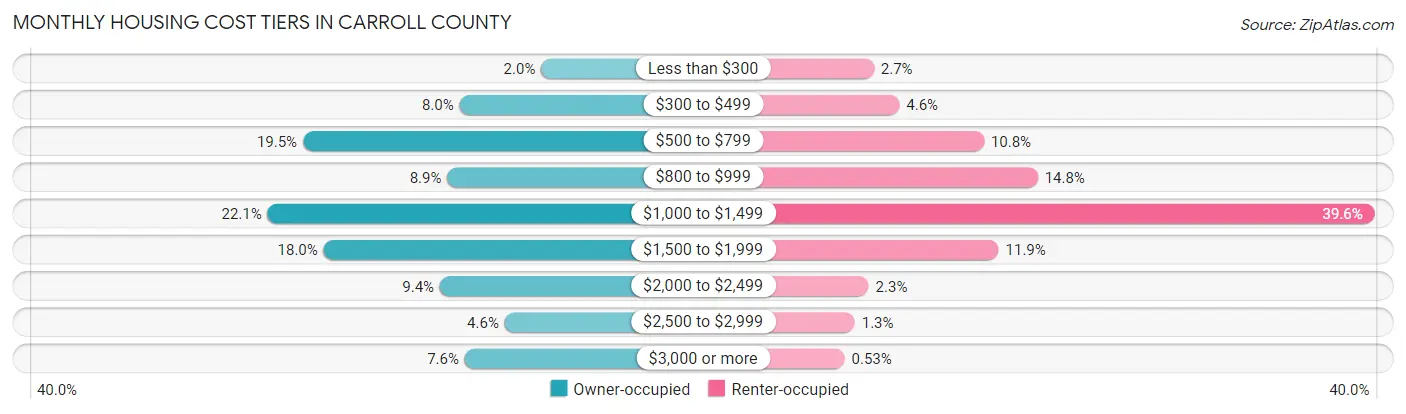
| Monthly Cost | Owner-occupied | Renter-occupied |
| Less than $300 | 344 (1.9%) | 107 (2.7%) |
| $300 to $499 | 1,406 (8.0%) | 182 (4.6%) |
| $500 to $799 | 3,441 (19.5%) | 431 (10.8%) |
| $800 to $999 | 1,566 (8.9%) | 589 (14.7%) |
| $1,000 to $1,499 | 3,902 (22.1%) | 1,580 (39.6%) |
| $1,500 to $1,999 | 3,173 (18.0%) | 474 (11.9%) |
| $2,000 to $2,499 | 1,661 (9.4%) | 92 (2.3%) |
| $2,500 to $2,999 | 819 (4.6%) | 51 (1.3%) |
| $3,000 or more | 1,338 (7.6%) | 21 (0.5%) |
| Total | 17,650 (100.0%) | 3,994 (100.0%) |
Physical Housing Characteristics in Carroll County
Housing Structures in Carroll County
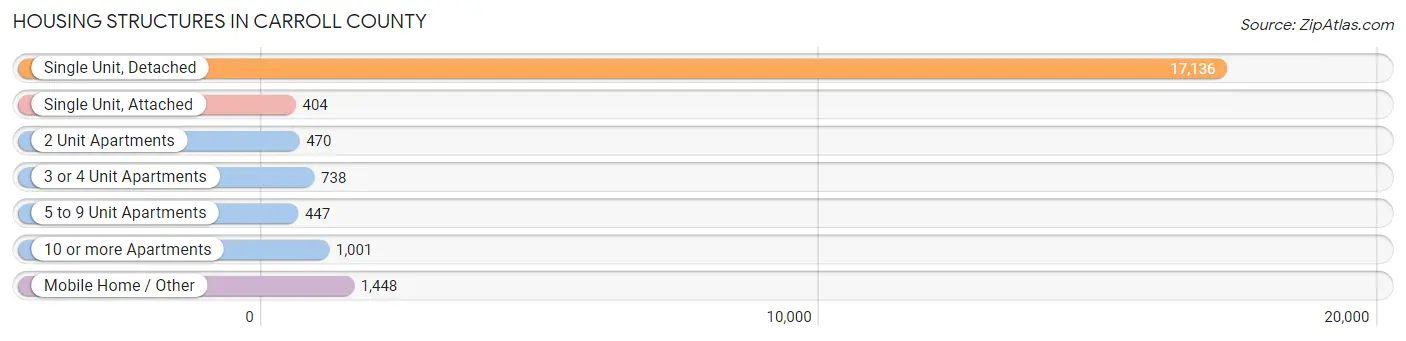
| Structure Type | # Housing Units | % Housing Units |
| Single Unit, Detached | 17,136 | 79.2% |
| Single Unit, Attached | 404 | 1.9% |
| 2 Unit Apartments | 470 | 2.2% |
| 3 or 4 Unit Apartments | 738 | 3.4% |
| 5 to 9 Unit Apartments | 447 | 2.1% |
| 10 or more Apartments | 1,001 | 4.6% |
| Mobile Home / Other | 1,448 | 6.7% |
| Total | 21,644 | 100.0% |
Housing Structures by Occupancy in Carroll County
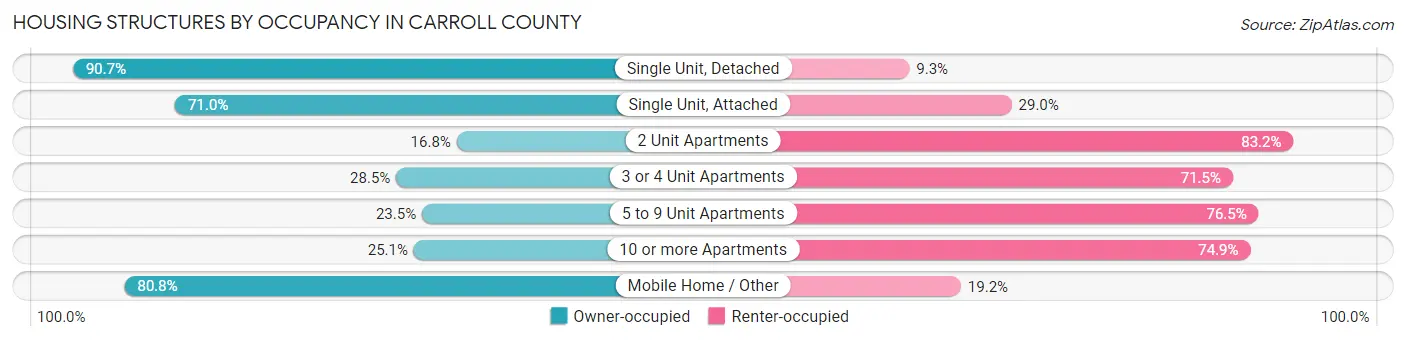
| Structure Type | Owner-occupied | Renter-occupied |
| Single Unit, Detached | 15,548 (90.7%) | 1,588 (9.3%) |
| Single Unit, Attached | 287 (71.0%) | 117 (29.0%) |
| 2 Unit Apartments | 79 (16.8%) | 391 (83.2%) |
| 3 or 4 Unit Apartments | 210 (28.5%) | 528 (71.5%) |
| 5 to 9 Unit Apartments | 105 (23.5%) | 342 (76.5%) |
| 10 or more Apartments | 251 (25.1%) | 750 (74.9%) |
| Mobile Home / Other | 1,170 (80.8%) | 278 (19.2%) |
| Total | 17,650 (81.6%) | 3,994 (18.4%) |
Housing Structures by Number of Rooms in Carroll County
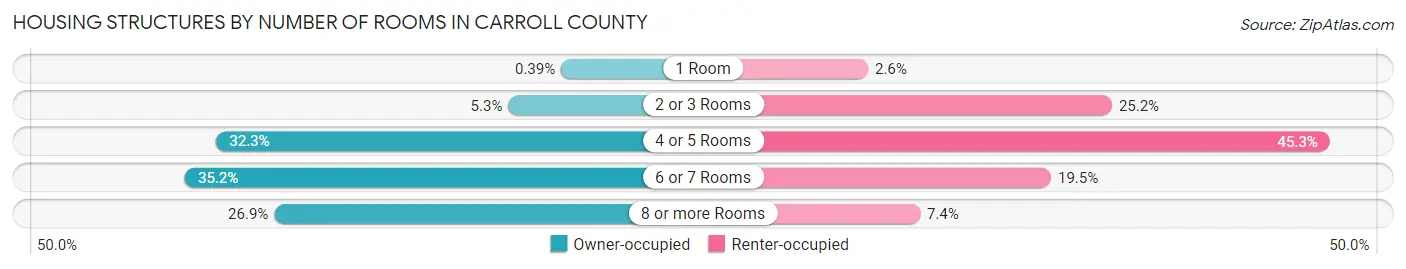
| Number of Rooms | Owner-occupied | Renter-occupied |
| 1 Room | 69 (0.4%) | 104 (2.6%) |
| 2 or 3 Rooms | 930 (5.3%) | 1,005 (25.2%) |
| 4 or 5 Rooms | 5,694 (32.3%) | 1,809 (45.3%) |
| 6 or 7 Rooms | 6,206 (35.2%) | 780 (19.5%) |
| 8 or more Rooms | 4,751 (26.9%) | 296 (7.4%) |
| Total | 17,650 (100.0%) | 3,994 (100.0%) |
Housing Structure by Heating Type in Carroll County
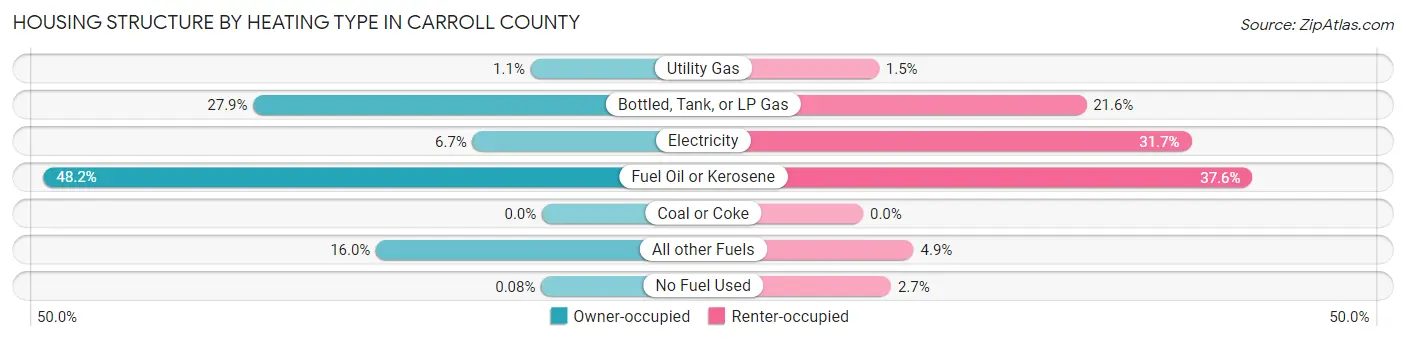
| Heating Type | Owner-occupied | Renter-occupied |
| Utility Gas | 194 (1.1%) | 61 (1.5%) |
| Bottled, Tank, or LP Gas | 4,924 (27.9%) | 861 (21.6%) |
| Electricity | 1,185 (6.7%) | 1,267 (31.7%) |
| Fuel Oil or Kerosene | 8,503 (48.2%) | 1,502 (37.6%) |
| Coal or Coke | 0 (0.0%) | 0 (0.0%) |
| All other Fuels | 2,830 (16.0%) | 195 (4.9%) |
| No Fuel Used | 14 (0.1%) | 108 (2.7%) |
| Total | 17,650 (100.0%) | 3,994 (100.0%) |
Household Vehicle Usage in Carroll County
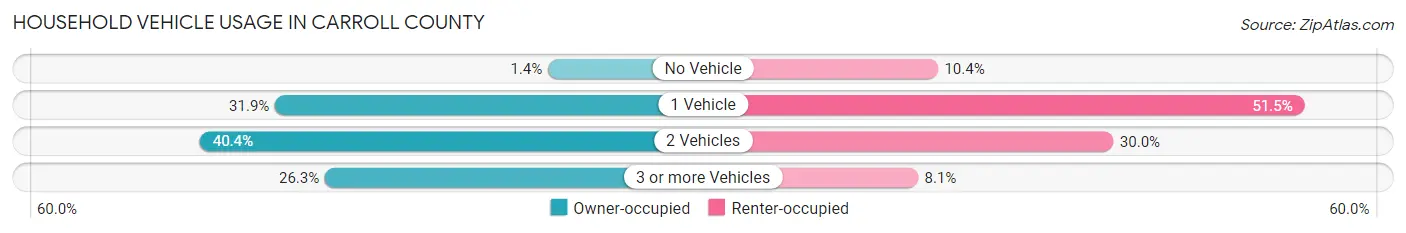
| Vehicles per Household | Owner-occupied | Renter-occupied |
| No Vehicle | 240 (1.4%) | 414 (10.4%) |
| 1 Vehicle | 5,636 (31.9%) | 2,056 (51.5%) |
| 2 Vehicles | 7,125 (40.4%) | 1,199 (30.0%) |
| 3 or more Vehicles | 4,649 (26.3%) | 325 (8.1%) |
| Total | 17,650 (100.0%) | 3,994 (100.0%) |
Real Estate & Mortgages in Carroll County
Real Estate and Mortgage Overview in Carroll County
| Characteristic | Without Mortgage | With Mortgage |
| Housing Units | 8,008 | 9,642 |
| Median Property Value | $311,300 | $320,800 |
| Median Household Income | $61,379 | $2,307 |
| Monthly Housing Costs | $702 | $1,275 |
| Real Estate Taxes | $3,536 | $22 |
Property Value by Mortgage Status in Carroll County
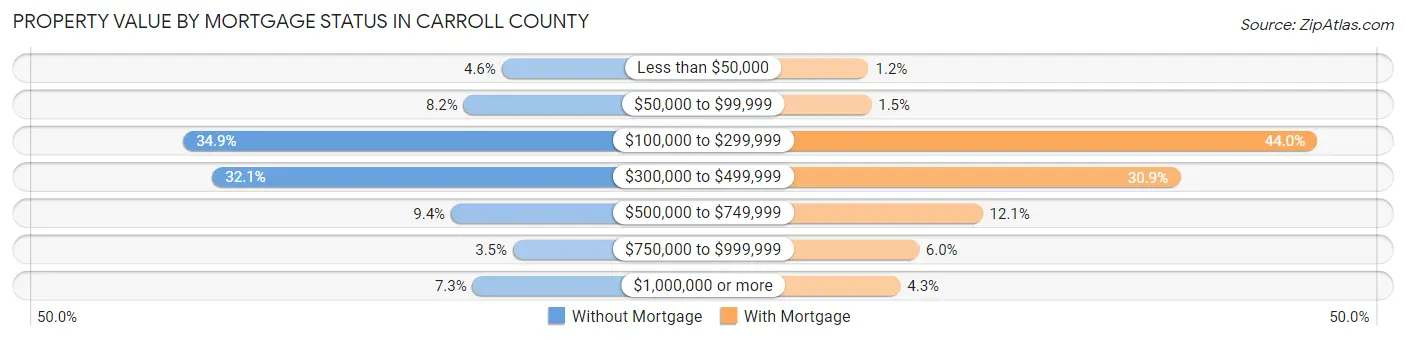
| Property Value | Without Mortgage | With Mortgage |
| Less than $50,000 | 366 (4.6%) | 120 (1.2%) |
| $50,000 to $99,999 | 656 (8.2%) | 145 (1.5%) |
| $100,000 to $299,999 | 2,794 (34.9%) | 4,238 (44.0%) |
| $300,000 to $499,999 | 2,571 (32.1%) | 2,979 (30.9%) |
| $500,000 to $749,999 | 753 (9.4%) | 1,167 (12.1%) |
| $750,000 to $999,999 | 280 (3.5%) | 581 (6.0%) |
| $1,000,000 or more | 588 (7.3%) | 412 (4.3%) |
| Total | 8,008 (100.0%) | 9,642 (100.0%) |
Household Income by Mortgage Status in Carroll County

| Household Income | Without Mortgage | With Mortgage |
| Less than $10,000 | 329 (4.1%) | 243 (2.5%) |
| $10,000 to $24,999 | 1,052 (13.1%) | 226 (2.3%) |
| $25,000 to $34,999 | 861 (10.7%) | 421 (4.4%) |
| $35,000 to $49,999 | 1,010 (12.6%) | 506 (5.2%) |
| $50,000 to $74,999 | 1,199 (15.0%) | 797 (8.3%) |
| $75,000 to $99,999 | 1,097 (13.7%) | 1,458 (15.1%) |
| $100,000 to $149,999 | 1,167 (14.6%) | 1,359 (14.1%) |
| $150,000 or more | 1,293 (16.2%) | 2,568 (26.6%) |
| Total | 8,008 (100.0%) | 9,642 (100.0%) |
Property Value to Household Income Ratio in Carroll County
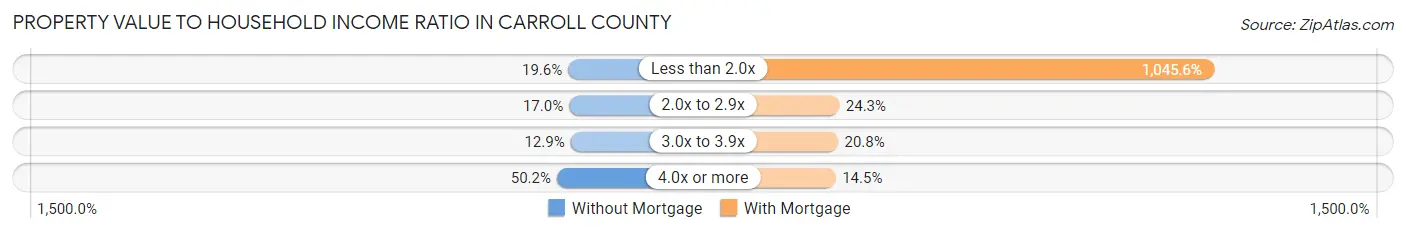
| Value-to-Income Ratio | Without Mortgage | With Mortgage |
| Less than 2.0x | 1,573 (19.6%) | 100,813 (1,045.6%) |
| 2.0x to 2.9x | 1,357 (17.0%) | 2,342 (24.3%) |
| 3.0x to 3.9x | 1,033 (12.9%) | 2,001 (20.7%) |
| 4.0x or more | 4,023 (50.2%) | 1,398 (14.5%) |
| Total | 8,008 (100.0%) | 9,642 (100.0%) |
Real Estate Taxes by Mortgage Status in Carroll County
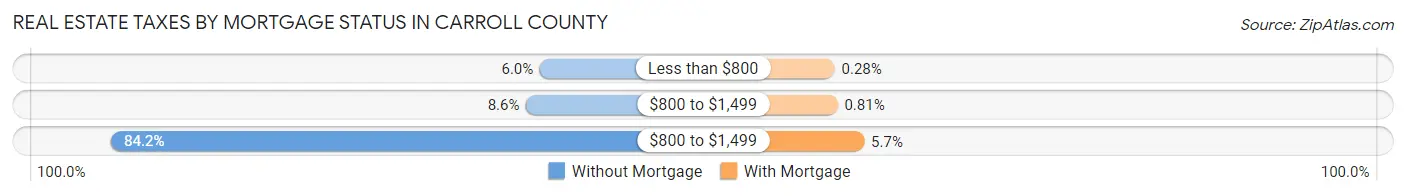
| Property Taxes | Without Mortgage | With Mortgage |
| Less than $800 | 482 (6.0%) | 27 (0.3%) |
| $800 to $1,499 | 685 (8.6%) | 78 (0.8%) |
| $800 to $1,499 | 6,742 (84.2%) | 548 (5.7%) |
| Total | 8,008 (100.0%) | 9,642 (100.0%) |
Health & Disability in Carroll County
Health Insurance Coverage by Age in Carroll County
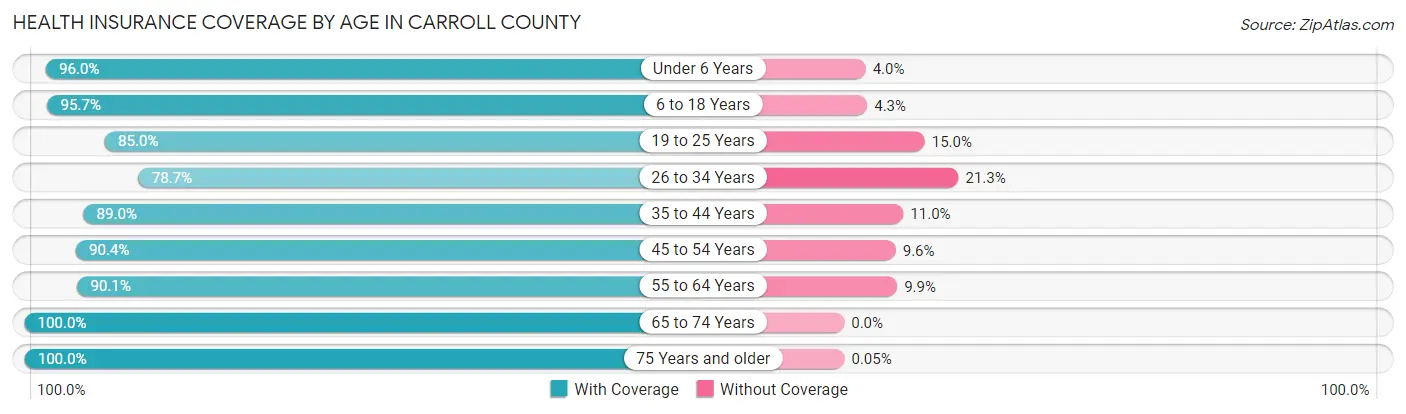
| Age Bracket | With Coverage | Without Coverage |
| Under 6 Years | 2,162 (96.0%) | 90 (4.0%) |
| 6 to 18 Years | 5,716 (95.7%) | 256 (4.3%) |
| 19 to 25 Years | 2,348 (85.0%) | 415 (15.0%) |
| 26 to 34 Years | 3,441 (78.7%) | 932 (21.3%) |
| 35 to 44 Years | 4,265 (89.0%) | 528 (11.0%) |
| 45 to 54 Years | 5,482 (90.4%) | 582 (9.6%) |
| 55 to 64 Years | 8,583 (90.1%) | 940 (9.9%) |
| 65 to 74 Years | 9,055 (100.0%) | 0 (0.0%) |
| 75 Years and older | 5,479 (100.0%) | 3 (0.1%) |
| Total | 46,531 (92.5%) | 3,746 (7.4%) |
Health Insurance Coverage by Citizenship Status in Carroll County
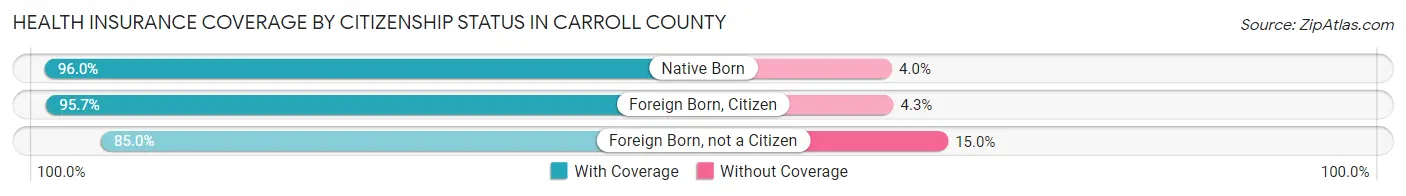
| Citizenship Status | With Coverage | Without Coverage |
| Native Born | 2,162 (96.0%) | 90 (4.0%) |
| Foreign Born, Citizen | 5,716 (95.7%) | 256 (4.3%) |
| Foreign Born, not a Citizen | 2,348 (85.0%) | 415 (15.0%) |
Health Insurance Coverage by Household Income in Carroll County
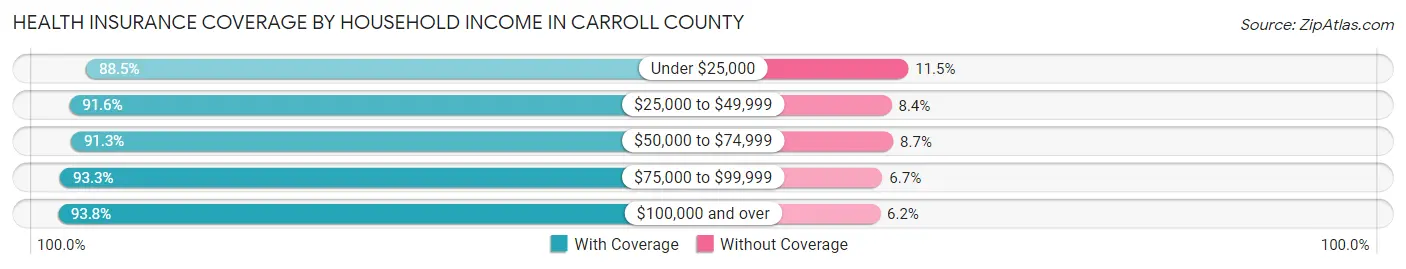
| Household Income | With Coverage | Without Coverage |
| Under $25,000 | 3,788 (88.5%) | 493 (11.5%) |
| $25,000 to $49,999 | 6,808 (91.6%) | 623 (8.4%) |
| $50,000 to $74,999 | 7,473 (91.3%) | 711 (8.7%) |
| $75,000 to $99,999 | 6,635 (93.3%) | 474 (6.7%) |
| $100,000 and over | 21,605 (93.8%) | 1,439 (6.2%) |
Public vs Private Health Insurance Coverage by Age in Carroll County
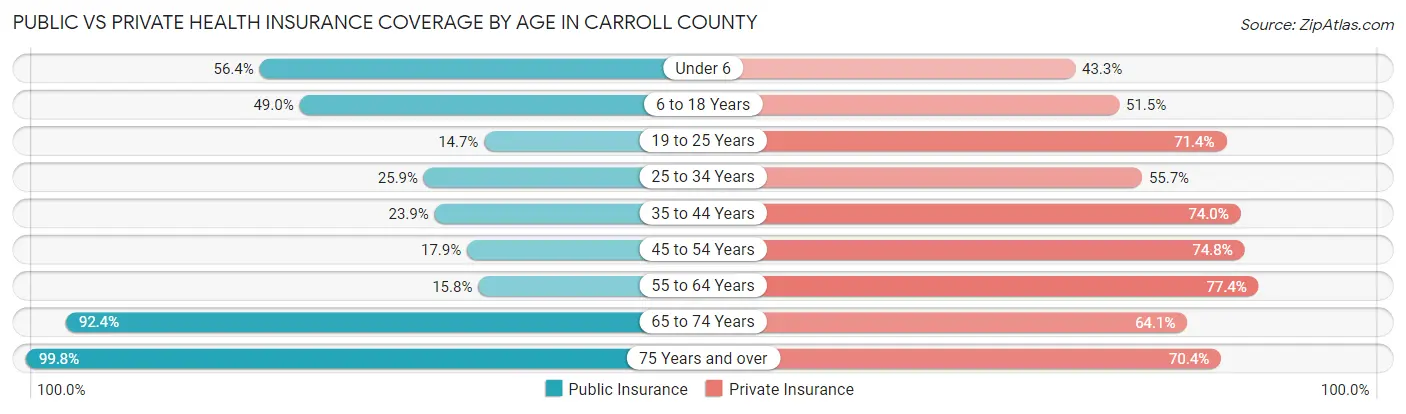
| Age Bracket | Public Insurance | Private Insurance |
| Under 6 | 1,270 (56.4%) | 975 (43.3%) |
| 6 to 18 Years | 2,925 (49.0%) | 3,073 (51.5%) |
| 19 to 25 Years | 406 (14.7%) | 1,972 (71.4%) |
| 25 to 34 Years | 1,132 (25.9%) | 2,436 (55.7%) |
| 35 to 44 Years | 1,146 (23.9%) | 3,548 (74.0%) |
| 45 to 54 Years | 1,084 (17.9%) | 4,533 (74.8%) |
| 55 to 64 Years | 1,505 (15.8%) | 7,368 (77.4%) |
| 65 to 74 Years | 8,362 (92.3%) | 5,805 (64.1%) |
| 75 Years and over | 5,469 (99.8%) | 3,860 (70.4%) |
| Total | 23,299 (46.3%) | 33,570 (66.8%) |
Disability Status by Sex by Age in Carroll County
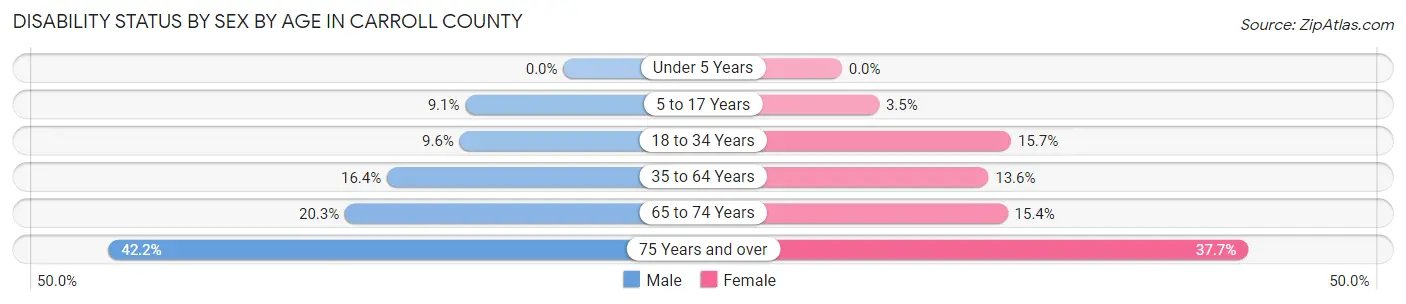
| Age Bracket | Male | Female |
| Under 5 Years | 0 (0.0%) | 0 (0.0%) |
| 5 to 17 Years | 295 (9.1%) | 94 (3.5%) |
| 18 to 34 Years | 388 (9.6%) | 568 (15.7%) |
| 35 to 64 Years | 1,642 (16.4%) | 1,407 (13.6%) |
| 65 to 74 Years | 930 (20.3%) | 687 (15.4%) |
| 75 Years and over | 1,112 (42.2%) | 1,074 (37.7%) |
Disability Class by Sex by Age in Carroll County
Disability Class: Hearing Difficulty
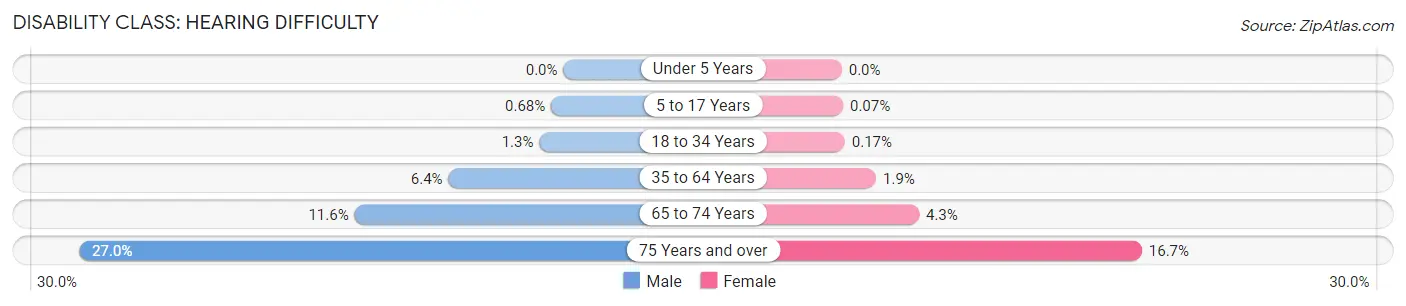
| Age Bracket | Male | Female |
| Under 5 Years | 0 (0.0%) | 0 (0.0%) |
| 5 to 17 Years | 22 (0.7%) | 2 (0.1%) |
| 18 to 34 Years | 54 (1.3%) | 6 (0.2%) |
| 35 to 64 Years | 642 (6.4%) | 198 (1.9%) |
| 65 to 74 Years | 534 (11.6%) | 192 (4.3%) |
| 75 Years and over | 710 (27.0%) | 476 (16.7%) |
Disability Class: Vision Difficulty
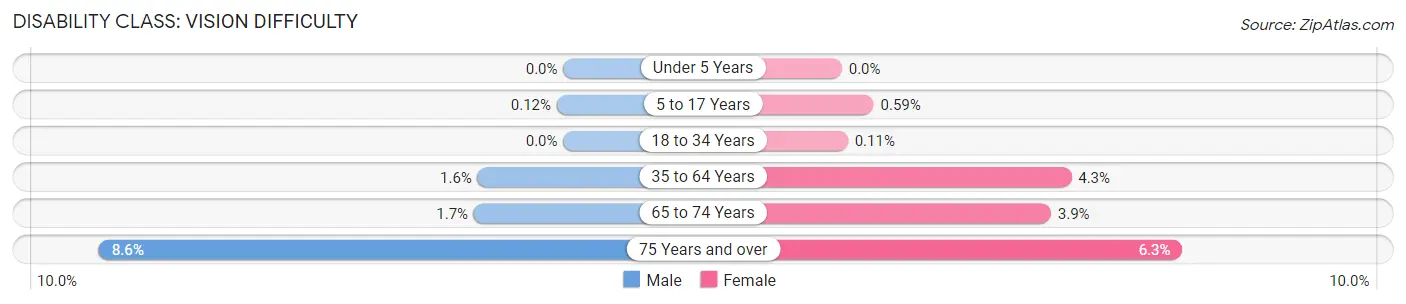
| Age Bracket | Male | Female |
| Under 5 Years | 0 (0.0%) | 0 (0.0%) |
| 5 to 17 Years | 4 (0.1%) | 16 (0.6%) |
| 18 to 34 Years | 0 (0.0%) | 4 (0.1%) |
| 35 to 64 Years | 160 (1.6%) | 441 (4.3%) |
| 65 to 74 Years | 76 (1.7%) | 173 (3.9%) |
| 75 Years and over | 227 (8.6%) | 180 (6.3%) |
Disability Class: Cognitive Difficulty
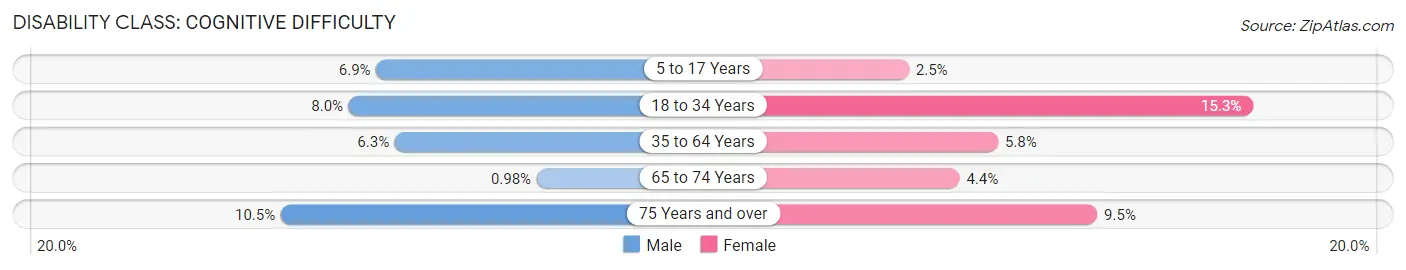
| Age Bracket | Male | Female |
| 5 to 17 Years | 225 (6.9%) | 68 (2.5%) |
| 18 to 34 Years | 321 (8.0%) | 552 (15.3%) |
| 35 to 64 Years | 627 (6.2%) | 600 (5.8%) |
| 65 to 74 Years | 45 (1.0%) | 195 (4.4%) |
| 75 Years and over | 276 (10.5%) | 270 (9.5%) |
Disability Class: Ambulatory Difficulty
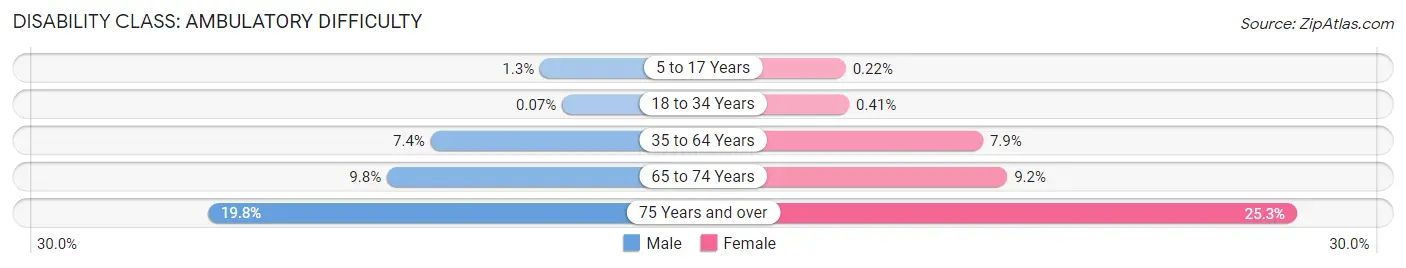
| Age Bracket | Male | Female |
| 5 to 17 Years | 42 (1.3%) | 6 (0.2%) |
| 18 to 34 Years | 3 (0.1%) | 15 (0.4%) |
| 35 to 64 Years | 742 (7.4%) | 813 (7.9%) |
| 65 to 74 Years | 451 (9.8%) | 411 (9.2%) |
| 75 Years and over | 521 (19.8%) | 722 (25.3%) |
Disability Class: Self-Care Difficulty
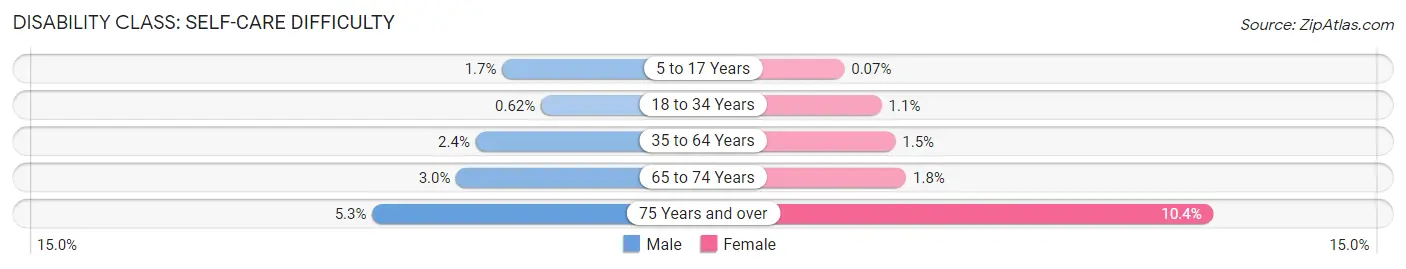
| Age Bracket | Male | Female |
| 5 to 17 Years | 55 (1.7%) | 2 (0.1%) |
| 18 to 34 Years | 25 (0.6%) | 40 (1.1%) |
| 35 to 64 Years | 245 (2.4%) | 154 (1.5%) |
| 65 to 74 Years | 137 (3.0%) | 80 (1.8%) |
| 75 Years and over | 140 (5.3%) | 295 (10.3%) |
Technology Access in Carroll County
Computing Device Access in Carroll County
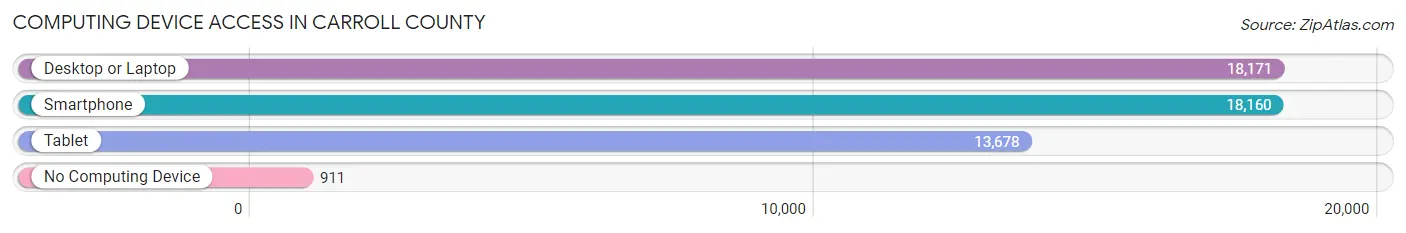
| Device Type | # Households | % Households |
| Desktop or Laptop | 18,171 | 84.0% |
| Smartphone | 18,160 | 83.9% |
| Tablet | 13,678 | 63.2% |
| No Computing Device | 911 | 4.2% |
| Total | 21,644 | 100.0% |
Internet Access in Carroll County
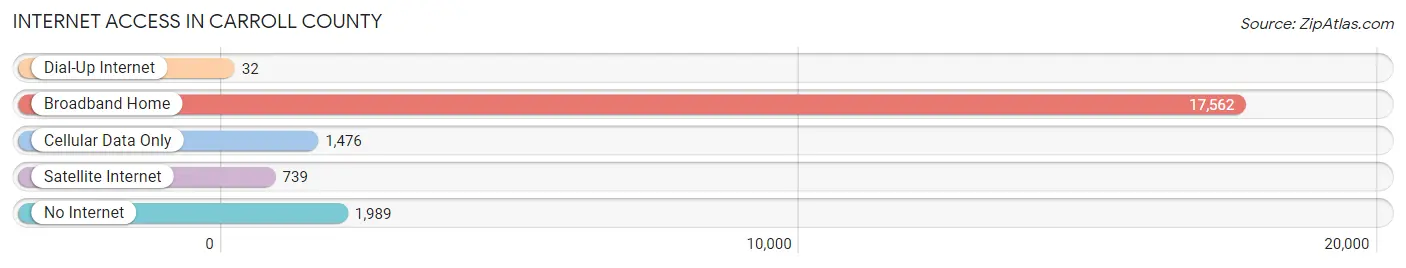
| Internet Type | # Households | % Households |
| Dial-Up Internet | 32 | 0.2% |
| Broadband Home | 17,562 | 81.1% |
| Cellular Data Only | 1,476 | 6.8% |
| Satellite Internet | 739 | 3.4% |
| No Internet | 1,989 | 9.2% |
| Total | 21,644 | 100.0% |
Carroll County Summary
Carroll County is a county located in the state of New Hampshire, in the United States. It is the northernmost county in the state and is bordered by Maine to the east, the White Mountains to the west, and the Atlantic Ocean to the south. The county seat is Ossipee. As of the 2010 census, the population was 47,818.
Geography
Carroll County is located in the northern part of New Hampshire, and is bordered by Maine to the east, the White Mountains to the west, and the Atlantic Ocean to the south. The county has a total area of 1,042 square miles, of which 1,026 square miles is land and 16 square miles is water. The highest point in the county is Mount Washington, at 6,288 feet. The county is home to several rivers, including the Saco, Ossipee, and Androscoggin.
The county is divided into seven townships: Albany, Bartlett, Conway, Eaton, Freedom, Madison, and Ossipee. The towns of Conway, Eaton, Freedom, Madison, and Ossipee are all located in the county.
History
Carroll County was established in 1840, and was named after Charles Carroll of Carrollton, the last surviving signer of the Declaration of Independence. The county was originally part of Strafford County, and was created from parts of Strafford, Coos, and Grafton counties.
The county was originally home to the Abenaki Native American tribe, who lived in the area for thousands of years before the arrival of European settlers. The first European settlers arrived in the area in the late 17th century, and the county was officially established in 1840.
Economy
The economy of Carroll County is largely based on tourism, with the county being home to several ski resorts, including Attitash Mountain Resort, Cranmore Mountain Resort, and Wildcat Mountain Ski Area. The county is also home to several state parks, including Bear Brook State Park, Conway Scenic Railroad, and White Mountain National Forest.
The county is also home to several manufacturing companies, including the Conway Manufacturing Company, which produces paper products, and the North Conway Lumber Company, which produces lumber and wood products.
Demographics
As of the 2010 census, the population of Carroll County was 47,818, with a population density of 46.3 people per square mile. The median age of the population was 44.7 years, and the median household income was $50,945.
The racial makeup of the county was 95.3% White, 0.7% African American, 0.5% Native American, 0.7% Asian, 0.1% Pacific Islander, 1.2% from other races, and 1.5% from two or more races. Hispanic or Latino of any race were 2.3% of the population.
The largest ancestry groups in the county were English (30.2%), Irish (20.2%), French (14.2%), German (13.2%), and Italian (4.2%).
Conclusion
Carroll County is a county located in the northern part of New Hampshire, and is bordered by Maine to the east, the White Mountains to the west, and the Atlantic Ocean to the south. The county has a population of 47,818, and is largely based on tourism, with several ski resorts and state parks located in the area. The county is also home to several manufacturing companies, and the largest ancestry groups in the county are English, Irish, French, German, and Italian.
Common Questions
What is Per Capita Income in Carroll County?
Per Capita income in Carroll County is $48,199.
What is the Median Family Income in Carroll County?
Median Family Income in Carroll County is $94,101.
What is the Median Household income in Carroll County?
Median Household Income in Carroll County is $77,049.
What is Income or Wage Gap in Carroll County?
Income or Wage Gap in Carroll County is 24.5%.
Women in Carroll County earn 75.5 cents for every dollar earned by a man.
What is Family Income Deficit in Carroll County?
Family Income Deficit in Carroll County is $10,269.
Families that are below poverty line in Carroll County earn $10,269 less on average than the poverty threshold level.
What is Inequality or Gini Index in Carroll County?
Inequality or Gini Index in Carroll County is 0.48.
What is the Total Population of Carroll County?
Total Population of Carroll County is 50,679.
What is the Total Male Population of Carroll County?
Total Male Population of Carroll County is 25,655.
What is the Total Female Population of Carroll County?
Total Female Population of Carroll County is 25,024.
What is the Ratio of Males per 100 Females in Carroll County?
There are 102.52 Males per 100 Females in Carroll County.
What is the Ratio of Females per 100 Males in Carroll County?
There are 97.54 Females per 100 Males in Carroll County.
What is the Median Population Age in Carroll County?
Median Population Age in Carroll County is 53.8 Years.
What is the Average Family Size in Carroll County
Average Family Size in Carroll County is 2.9 People.
What is the Average Household Size in Carroll County
Average Household Size in Carroll County is 2.3 People.
How Large is the Labor Force in Carroll County?
There are 26,345 People in the Labor Forcein in Carroll County.
What is the Percentage of People in the Labor Force in Carroll County?
59.8% of People are in the Labor Force in Carroll County.
What is the Unemployment Rate in Carroll County?
Unemployment Rate in Carroll County is 5.6%.