Guamanian/Chamorro vs Immigrants from Hong Kong Median Female Earnings
COMPARE
Guamanian/Chamorro
Immigrants from Hong Kong
Median Female Earnings
Median Female Earnings Comparison
Guamanians/Chamorros
Immigrants from Hong Kong
$38,717
MEDIAN FEMALE EARNINGS
11.5/ 100
METRIC RATING
212th/ 347
METRIC RANK
$49,818
MEDIAN FEMALE EARNINGS
100.0/ 100
METRIC RATING
1st/ 347
METRIC RANK
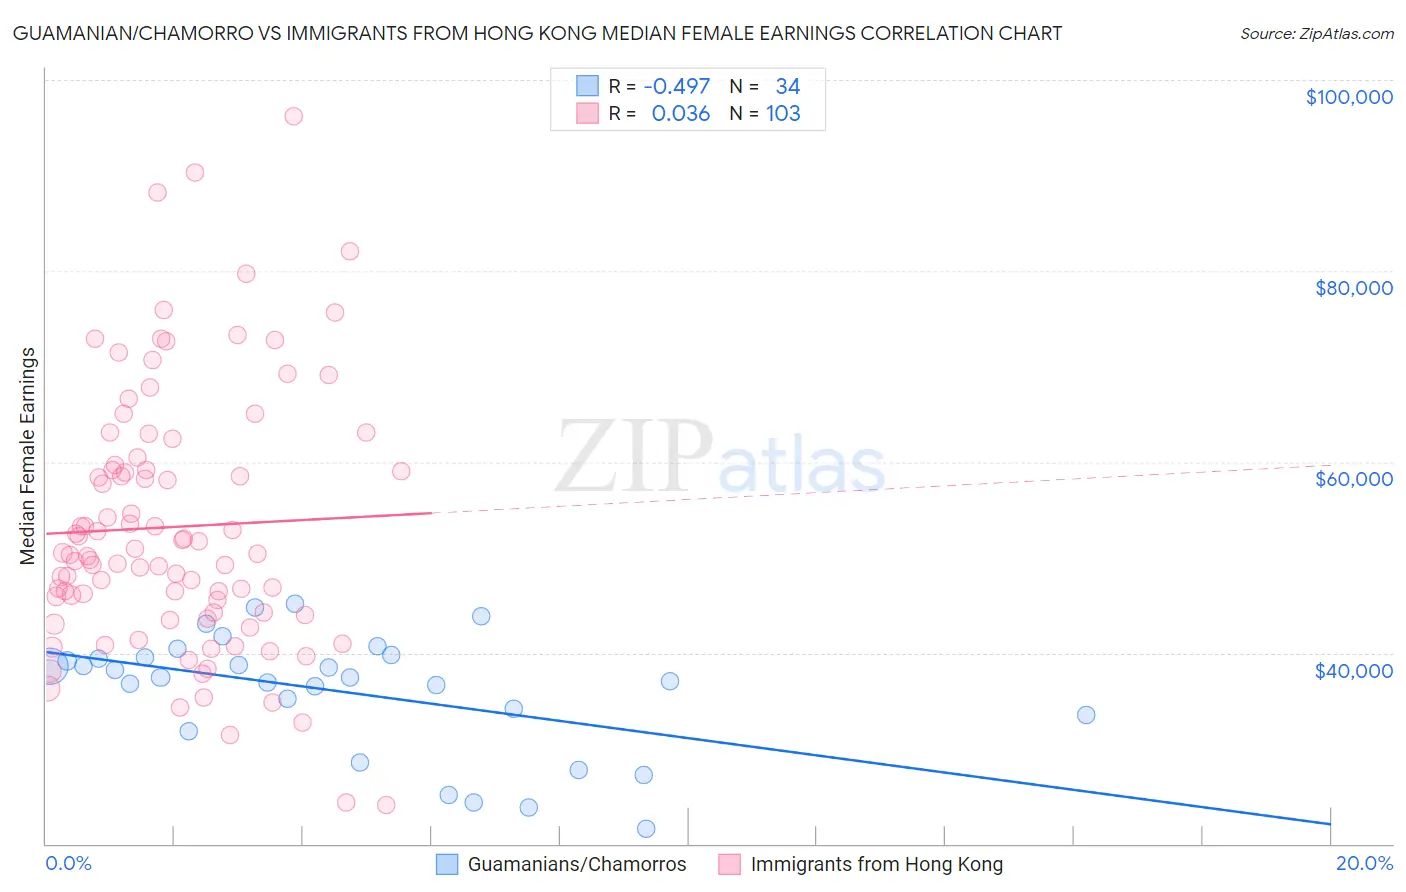
Guamanian/Chamorro vs Immigrants from Hong Kong Median Female Earnings Correlation Chart
The statistical analysis conducted on geographies consisting of 221,909,570 people shows a moderate negative correlation between the proportion of Guamanians/Chamorros and median female earnings in the United States with a correlation coefficient (R) of -0.497 and weighted average of $38,717. Similarly, the statistical analysis conducted on geographies consisting of 253,932,744 people shows no correlation between the proportion of Immigrants from Hong Kong and median female earnings in the United States with a correlation coefficient (R) of 0.036 and weighted average of $49,818, a difference of 28.7%.
Median Female Earnings Correlation Summary
| Measurement | Guamanian/Chamorro | Immigrants from Hong Kong |
| Minimum | $21,607 | $24,038 |
| Maximum | $45,111 | $96,250 |
| Range | $23,504 | $72,212 |
| Mean | $35,932 | $53,195 |
| Median | $37,420 | $50,354 |
| Interquartile 25% (IQ1) | $33,542 | $44,209 |
| Interquartile 75% (IQ3) | $39,523 | $59,618 |
| Interquartile Range (IQR) | $5,981 | $15,409 |
| Standard Deviation (Sample) | $6,215 | $13,646 |
| Standard Deviation (Population) | $6,122 | $13,580 |
Similar Demographics by Median Female Earnings
Demographics Similar to Guamanians/Chamorros by Median Female Earnings
In terms of median female earnings, the demographic groups most similar to Guamanians/Chamorros are Aleut ($38,719, a difference of 0.010%), Czechoslovakian ($38,738, a difference of 0.050%), Jamaican ($38,670, a difference of 0.12%), Iraqi ($38,666, a difference of 0.13%), and Spaniard ($38,656, a difference of 0.16%).
| Demographics | Rating | Rank | Median Female Earnings |
| Immigrants | Colombia | 16.3 /100 | #205 | Poor $38,913 |
| Immigrants | Bosnia and Herzegovina | 15.6 /100 | #206 | Poor $38,886 |
| Immigrants | Cambodia | 14.2 /100 | #207 | Poor $38,833 |
| Immigrants | Thailand | 13.6 /100 | #208 | Poor $38,810 |
| Norwegians | 13.4 /100 | #209 | Poor $38,802 |
| Czechoslovakians | 12.0 /100 | #210 | Poor $38,738 |
| Aleuts | 11.6 /100 | #211 | Poor $38,719 |
| Guamanians/Chamorros | 11.5 /100 | #212 | Poor $38,717 |
| Jamaicans | 10.5 /100 | #213 | Poor $38,670 |
| Iraqis | 10.5 /100 | #214 | Poor $38,666 |
| Spaniards | 10.3 /100 | #215 | Poor $38,656 |
| Immigrants | Ecuador | 10.1 /100 | #216 | Poor $38,644 |
| Immigrants | Jamaica | 9.7 /100 | #217 | Tragic $38,625 |
| Cape Verdeans | 9.5 /100 | #218 | Tragic $38,614 |
| Nepalese | 9.3 /100 | #219 | Tragic $38,603 |
Demographics Similar to Immigrants from Hong Kong by Median Female Earnings
In terms of median female earnings, the demographic groups most similar to Immigrants from Hong Kong are Filipino ($49,508, a difference of 0.63%), Immigrants from Taiwan ($49,256, a difference of 1.1%), Immigrants from India ($48,292, a difference of 3.2%), Immigrants from Singapore ($47,986, a difference of 3.8%), and Immigrants from Ireland ($47,598, a difference of 4.7%).
| Demographics | Rating | Rank | Median Female Earnings |
| Immigrants | Hong Kong | 100.0 /100 | #1 | Exceptional $49,818 |
| Filipinos | 100.0 /100 | #2 | Exceptional $49,508 |
| Immigrants | Taiwan | 100.0 /100 | #3 | Exceptional $49,256 |
| Immigrants | India | 100.0 /100 | #4 | Exceptional $48,292 |
| Immigrants | Singapore | 100.0 /100 | #5 | Exceptional $47,986 |
| Immigrants | Ireland | 100.0 /100 | #6 | Exceptional $47,598 |
| Thais | 100.0 /100 | #7 | Exceptional $47,577 |
| Iranians | 100.0 /100 | #8 | Exceptional $47,421 |
| Immigrants | Iran | 100.0 /100 | #9 | Exceptional $47,154 |
| Immigrants | China | 100.0 /100 | #10 | Exceptional $46,972 |
| Okinawans | 100.0 /100 | #11 | Exceptional $46,905 |
| Immigrants | Israel | 100.0 /100 | #12 | Exceptional $46,902 |
| Immigrants | Australia | 100.0 /100 | #13 | Exceptional $46,573 |
| Soviet Union | 100.0 /100 | #14 | Exceptional $46,556 |
| Immigrants | Eastern Asia | 100.0 /100 | #15 | Exceptional $46,502 |