Assyrian/Chaldean/Syriac vs Armenian Median Male Earnings
COMPARE
Assyrian/Chaldean/Syriac
Armenian
Median Male Earnings
Median Male Earnings Comparison
Assyrians/Chaldeans/Syriacs
Armenians
$58,437
MEDIAN MALE EARNINGS
97.9/ 100
METRIC RATING
100th/ 347
METRIC RANK
$58,134
MEDIAN MALE EARNINGS
97.3/ 100
METRIC RATING
104th/ 347
METRIC RANK
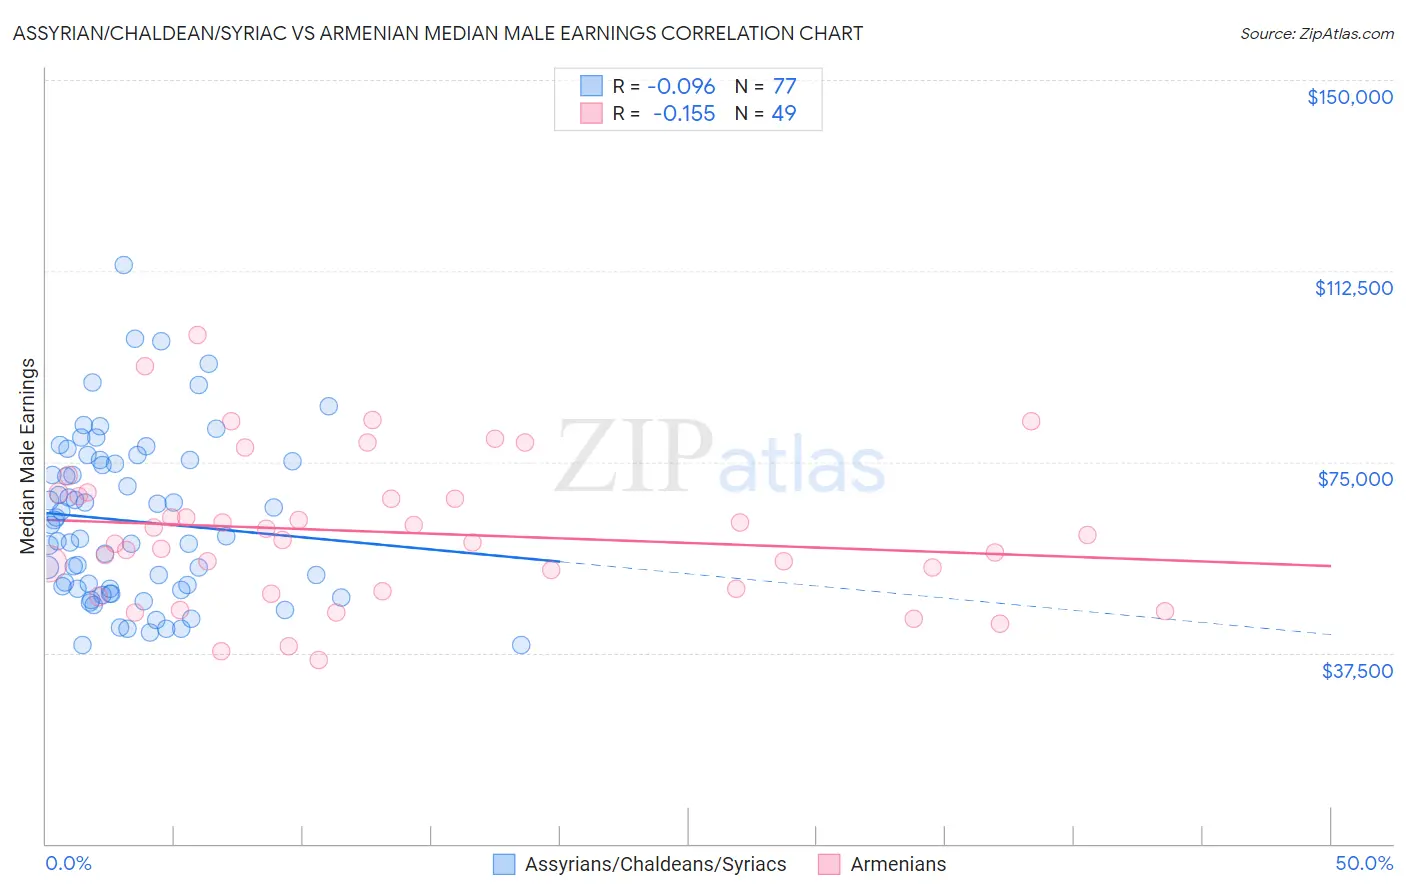
Assyrian/Chaldean/Syriac vs Armenian Median Male Earnings Correlation Chart
The statistical analysis conducted on geographies consisting of 110,268,457 people shows a slight negative correlation between the proportion of Assyrians/Chaldeans/Syriacs and median male earnings in the United States with a correlation coefficient (R) of -0.096 and weighted average of $58,437. Similarly, the statistical analysis conducted on geographies consisting of 310,896,747 people shows a poor negative correlation between the proportion of Armenians and median male earnings in the United States with a correlation coefficient (R) of -0.155 and weighted average of $58,134, a difference of 0.52%.
Median Male Earnings Correlation Summary
| Measurement | Assyrian/Chaldean/Syriac | Armenian |
| Minimum | $38,990 | $36,151 |
| Maximum | $113,676 | $99,997 |
| Range | $74,686 | $63,846 |
| Mean | $63,347 | $61,183 |
| Median | $60,406 | $59,670 |
| Interquartile 25% (IQ1) | $49,882 | $49,867 |
| Interquartile 75% (IQ3) | $75,136 | $68,550 |
| Interquartile Range (IQR) | $25,254 | $18,683 |
| Standard Deviation (Sample) | $16,152 | $14,235 |
| Standard Deviation (Population) | $16,047 | $14,089 |
Demographics Similar to Assyrians/Chaldeans/Syriacs and Armenians by Median Male Earnings
In terms of median male earnings, the demographic groups most similar to Assyrians/Chaldeans/Syriacs are Immigrants from Poland ($58,452, a difference of 0.030%), Jordanian ($58,500, a difference of 0.11%), Immigrants from Brazil ($58,324, a difference of 0.19%), Northern European ($58,588, a difference of 0.26%), and Albanian ($58,680, a difference of 0.42%). Similarly, the demographic groups most similar to Armenians are Polish ($58,139, a difference of 0.010%), Immigrants from Western Asia ($58,131, a difference of 0.010%), Syrian ($58,187, a difference of 0.090%), Immigrants from Northern Africa ($58,008, a difference of 0.22%), and Serbian ($57,975, a difference of 0.27%).
| Demographics | Rating | Rank | Median Male Earnings |
| Immigrants | Kazakhstan | 99.1 /100 | #92 | Exceptional $59,278 |
| Immigrants | Southern Europe | 99.0 /100 | #93 | Exceptional $59,217 |
| Immigrants | North Macedonia | 99.0 /100 | #94 | Exceptional $59,189 |
| Immigrants | Lebanon | 98.6 /100 | #95 | Exceptional $58,835 |
| Albanians | 98.4 /100 | #96 | Exceptional $58,680 |
| Northern Europeans | 98.2 /100 | #97 | Exceptional $58,588 |
| Jordanians | 98.1 /100 | #98 | Exceptional $58,500 |
| Immigrants | Poland | 98.0 /100 | #99 | Exceptional $58,452 |
| Assyrians/Chaldeans/Syriacs | 97.9 /100 | #100 | Exceptional $58,437 |
| Immigrants | Brazil | 97.7 /100 | #101 | Exceptional $58,324 |
| Syrians | 97.4 /100 | #102 | Exceptional $58,187 |
| Poles | 97.3 /100 | #103 | Exceptional $58,139 |
| Armenians | 97.3 /100 | #104 | Exceptional $58,134 |
| Immigrants | Western Asia | 97.3 /100 | #105 | Exceptional $58,131 |
| Immigrants | Northern Africa | 96.9 /100 | #106 | Exceptional $58,008 |
| Serbians | 96.8 /100 | #107 | Exceptional $57,975 |
| Immigrants | Uzbekistan | 96.7 /100 | #108 | Exceptional $57,941 |
| British | 96.5 /100 | #109 | Exceptional $57,890 |
| Palestinians | 96.2 /100 | #110 | Exceptional $57,778 |
| Europeans | 95.6 /100 | #111 | Exceptional $57,637 |
| Immigrants | Afghanistan | 95.4 /100 | #112 | Exceptional $57,582 |