Assyrian/Chaldean/Syriac vs Immigrants from Congo Median Male Earnings
COMPARE
Assyrian/Chaldean/Syriac
Immigrants from Congo
Median Male Earnings
Median Male Earnings Comparison
Assyrians/Chaldeans/Syriacs
Immigrants from Congo
$58,437
MEDIAN MALE EARNINGS
97.9/ 100
METRIC RATING
100th/ 347
METRIC RANK
$44,204
MEDIAN MALE EARNINGS
0.0/ 100
METRIC RATING
333rd/ 347
METRIC RANK
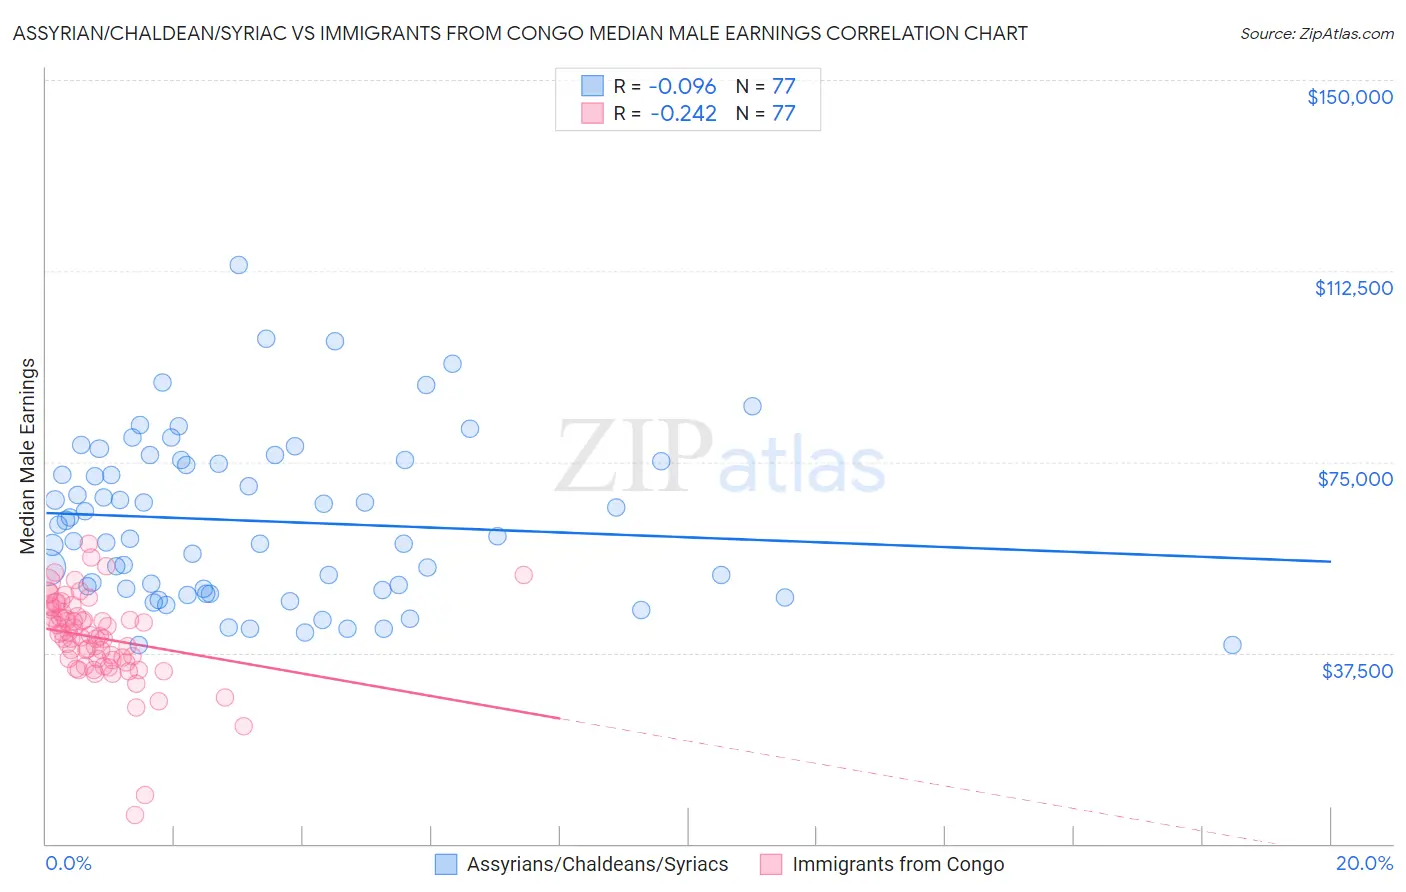
Assyrian/Chaldean/Syriac vs Immigrants from Congo Median Male Earnings Correlation Chart
The statistical analysis conducted on geographies consisting of 110,268,457 people shows a slight negative correlation between the proportion of Assyrians/Chaldeans/Syriacs and median male earnings in the United States with a correlation coefficient (R) of -0.096 and weighted average of $58,437. Similarly, the statistical analysis conducted on geographies consisting of 92,117,161 people shows a weak negative correlation between the proportion of Immigrants from Congo and median male earnings in the United States with a correlation coefficient (R) of -0.242 and weighted average of $44,204, a difference of 32.2%.
Median Male Earnings Correlation Summary
| Measurement | Assyrian/Chaldean/Syriac | Immigrants from Congo |
| Minimum | $38,990 | $5,667 |
| Maximum | $113,676 | $59,021 |
| Range | $74,686 | $53,354 |
| Mean | $63,347 | $40,451 |
| Median | $60,406 | $40,971 |
| Interquartile 25% (IQ1) | $49,882 | $35,851 |
| Interquartile 75% (IQ3) | $75,136 | $45,724 |
| Interquartile Range (IQR) | $25,254 | $9,873 |
| Standard Deviation (Sample) | $16,152 | $8,754 |
| Standard Deviation (Population) | $16,047 | $8,697 |
Similar Demographics by Median Male Earnings
Demographics Similar to Assyrians/Chaldeans/Syriacs by Median Male Earnings
In terms of median male earnings, the demographic groups most similar to Assyrians/Chaldeans/Syriacs are Immigrants from Poland ($58,452, a difference of 0.030%), Jordanian ($58,500, a difference of 0.11%), Immigrants from Brazil ($58,324, a difference of 0.19%), Northern European ($58,588, a difference of 0.26%), and Albanian ($58,680, a difference of 0.42%).
| Demographics | Rating | Rank | Median Male Earnings |
| Immigrants | Southern Europe | 99.0 /100 | #93 | Exceptional $59,217 |
| Immigrants | North Macedonia | 99.0 /100 | #94 | Exceptional $59,189 |
| Immigrants | Lebanon | 98.6 /100 | #95 | Exceptional $58,835 |
| Albanians | 98.4 /100 | #96 | Exceptional $58,680 |
| Northern Europeans | 98.2 /100 | #97 | Exceptional $58,588 |
| Jordanians | 98.1 /100 | #98 | Exceptional $58,500 |
| Immigrants | Poland | 98.0 /100 | #99 | Exceptional $58,452 |
| Assyrians/Chaldeans/Syriacs | 97.9 /100 | #100 | Exceptional $58,437 |
| Immigrants | Brazil | 97.7 /100 | #101 | Exceptional $58,324 |
| Syrians | 97.4 /100 | #102 | Exceptional $58,187 |
| Poles | 97.3 /100 | #103 | Exceptional $58,139 |
| Armenians | 97.3 /100 | #104 | Exceptional $58,134 |
| Immigrants | Western Asia | 97.3 /100 | #105 | Exceptional $58,131 |
| Immigrants | Northern Africa | 96.9 /100 | #106 | Exceptional $58,008 |
| Serbians | 96.8 /100 | #107 | Exceptional $57,975 |
Demographics Similar to Immigrants from Congo by Median Male Earnings
In terms of median male earnings, the demographic groups most similar to Immigrants from Congo are Immigrants from Yemen ($44,083, a difference of 0.27%), Spanish American Indian ($44,010, a difference of 0.44%), Bahamian ($44,756, a difference of 1.3%), Native/Alaskan ($44,775, a difference of 1.3%), and Immigrants from Mexico ($44,960, a difference of 1.7%).
| Demographics | Rating | Rank | Median Male Earnings |
| Immigrants | Haiti | 0.0 /100 | #326 | Tragic $45,266 |
| Immigrants | Bahamas | 0.0 /100 | #327 | Tragic $45,176 |
| Kiowa | 0.0 /100 | #328 | Tragic $45,094 |
| Yakama | 0.0 /100 | #329 | Tragic $45,002 |
| Immigrants | Mexico | 0.0 /100 | #330 | Tragic $44,960 |
| Natives/Alaskans | 0.0 /100 | #331 | Tragic $44,775 |
| Bahamians | 0.0 /100 | #332 | Tragic $44,756 |
| Immigrants | Congo | 0.0 /100 | #333 | Tragic $44,204 |
| Immigrants | Yemen | 0.0 /100 | #334 | Tragic $44,083 |
| Spanish American Indians | 0.0 /100 | #335 | Tragic $44,010 |
| Immigrants | Cuba | 0.0 /100 | #336 | Tragic $43,461 |
| Menominee | 0.0 /100 | #337 | Tragic $42,581 |
| Crow | 0.0 /100 | #338 | Tragic $42,434 |
| Pima | 0.0 /100 | #339 | Tragic $42,357 |
| Navajo | 0.0 /100 | #340 | Tragic $42,098 |