Assyrian/Chaldean/Syriac vs South American Indian Median Male Earnings
COMPARE
Assyrian/Chaldean/Syriac
South American Indian
Median Male Earnings
Median Male Earnings Comparison
Assyrians/Chaldeans/Syriacs
South American Indians
$58,437
MEDIAN MALE EARNINGS
97.9/ 100
METRIC RATING
100th/ 347
METRIC RANK
$54,508
MEDIAN MALE EARNINGS
50.4/ 100
METRIC RATING
173rd/ 347
METRIC RANK
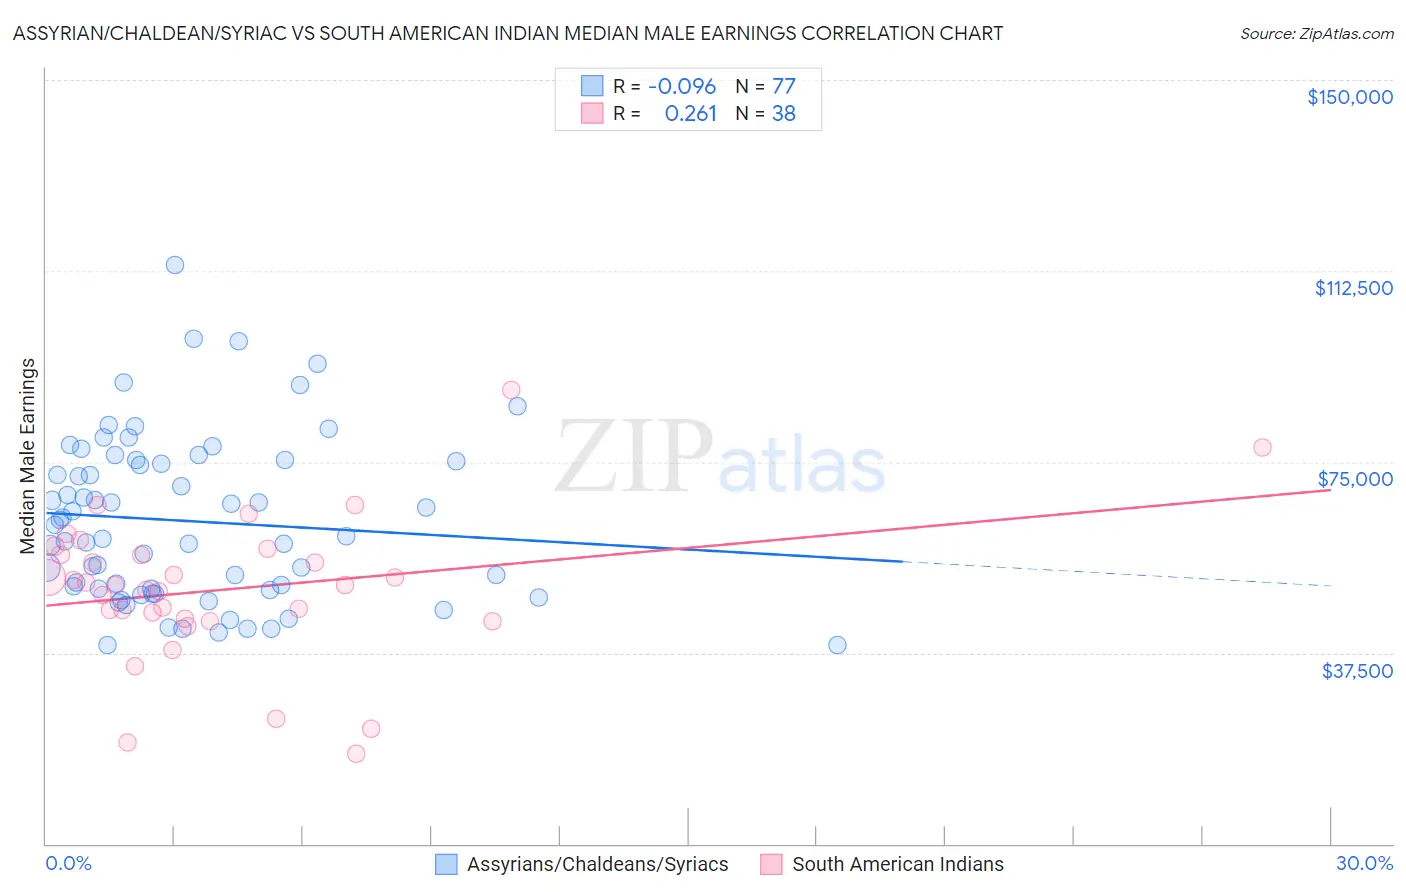
Assyrian/Chaldean/Syriac vs South American Indian Median Male Earnings Correlation Chart
The statistical analysis conducted on geographies consisting of 110,268,457 people shows a slight negative correlation between the proportion of Assyrians/Chaldeans/Syriacs and median male earnings in the United States with a correlation coefficient (R) of -0.096 and weighted average of $58,437. Similarly, the statistical analysis conducted on geographies consisting of 164,558,880 people shows a weak positive correlation between the proportion of South American Indians and median male earnings in the United States with a correlation coefficient (R) of 0.261 and weighted average of $54,508, a difference of 7.2%.
Median Male Earnings Correlation Summary
| Measurement | Assyrian/Chaldean/Syriac | South American Indian |
| Minimum | $38,990 | $17,560 |
| Maximum | $113,676 | $89,196 |
| Range | $74,686 | $71,636 |
| Mean | $63,347 | $49,938 |
| Median | $60,406 | $50,818 |
| Interquartile 25% (IQ1) | $49,882 | $44,221 |
| Interquartile 75% (IQ3) | $75,136 | $56,795 |
| Interquartile Range (IQR) | $25,254 | $12,575 |
| Standard Deviation (Sample) | $16,152 | $14,312 |
| Standard Deviation (Population) | $16,047 | $14,122 |
Similar Demographics by Median Male Earnings
Demographics Similar to Assyrians/Chaldeans/Syriacs by Median Male Earnings
In terms of median male earnings, the demographic groups most similar to Assyrians/Chaldeans/Syriacs are Immigrants from Poland ($58,452, a difference of 0.030%), Jordanian ($58,500, a difference of 0.11%), Immigrants from Brazil ($58,324, a difference of 0.19%), Northern European ($58,588, a difference of 0.26%), and Albanian ($58,680, a difference of 0.42%).
| Demographics | Rating | Rank | Median Male Earnings |
| Immigrants | Southern Europe | 99.0 /100 | #93 | Exceptional $59,217 |
| Immigrants | North Macedonia | 99.0 /100 | #94 | Exceptional $59,189 |
| Immigrants | Lebanon | 98.6 /100 | #95 | Exceptional $58,835 |
| Albanians | 98.4 /100 | #96 | Exceptional $58,680 |
| Northern Europeans | 98.2 /100 | #97 | Exceptional $58,588 |
| Jordanians | 98.1 /100 | #98 | Exceptional $58,500 |
| Immigrants | Poland | 98.0 /100 | #99 | Exceptional $58,452 |
| Assyrians/Chaldeans/Syriacs | 97.9 /100 | #100 | Exceptional $58,437 |
| Immigrants | Brazil | 97.7 /100 | #101 | Exceptional $58,324 |
| Syrians | 97.4 /100 | #102 | Exceptional $58,187 |
| Poles | 97.3 /100 | #103 | Exceptional $58,139 |
| Armenians | 97.3 /100 | #104 | Exceptional $58,134 |
| Immigrants | Western Asia | 97.3 /100 | #105 | Exceptional $58,131 |
| Immigrants | Northern Africa | 96.9 /100 | #106 | Exceptional $58,008 |
| Serbians | 96.8 /100 | #107 | Exceptional $57,975 |
Demographics Similar to South American Indians by Median Male Earnings
In terms of median male earnings, the demographic groups most similar to South American Indians are South American ($54,492, a difference of 0.030%), Dutch ($54,410, a difference of 0.18%), Spaniard ($54,401, a difference of 0.20%), Welsh ($54,647, a difference of 0.25%), and Immigrants from Peru ($54,695, a difference of 0.34%).
| Demographics | Rating | Rank | Median Male Earnings |
| Germans | 61.6 /100 | #166 | Good $54,974 |
| Immigrants | Fiji | 61.2 /100 | #167 | Good $54,958 |
| Immigrants | Vietnam | 60.2 /100 | #168 | Good $54,913 |
| French Canadians | 55.6 /100 | #169 | Average $54,722 |
| Finns | 55.6 /100 | #170 | Average $54,721 |
| Immigrants | Peru | 54.9 /100 | #171 | Average $54,695 |
| Welsh | 53.8 /100 | #172 | Average $54,647 |
| South American Indians | 50.4 /100 | #173 | Average $54,508 |
| South Americans | 50.0 /100 | #174 | Average $54,492 |
| Dutch | 48.0 /100 | #175 | Average $54,410 |
| Spaniards | 47.8 /100 | #176 | Average $54,401 |
| Costa Ricans | 44.8 /100 | #177 | Average $54,279 |
| Sierra Leoneans | 44.8 /100 | #178 | Average $54,279 |
| Celtics | 43.9 /100 | #179 | Average $54,242 |
| Iraqis | 42.5 /100 | #180 | Average $54,182 |