Assyrian/Chaldean/Syriac vs Immigrants from Saudi Arabia Median Male Earnings
COMPARE
Assyrian/Chaldean/Syriac
Immigrants from Saudi Arabia
Median Male Earnings
Median Male Earnings Comparison
Assyrians/Chaldeans/Syriacs
Immigrants from Saudi Arabia
$58,437
MEDIAN MALE EARNINGS
97.9/ 100
METRIC RATING
100th/ 347
METRIC RANK
$56,452
MEDIAN MALE EARNINGS
87.2/ 100
METRIC RATING
136th/ 347
METRIC RANK
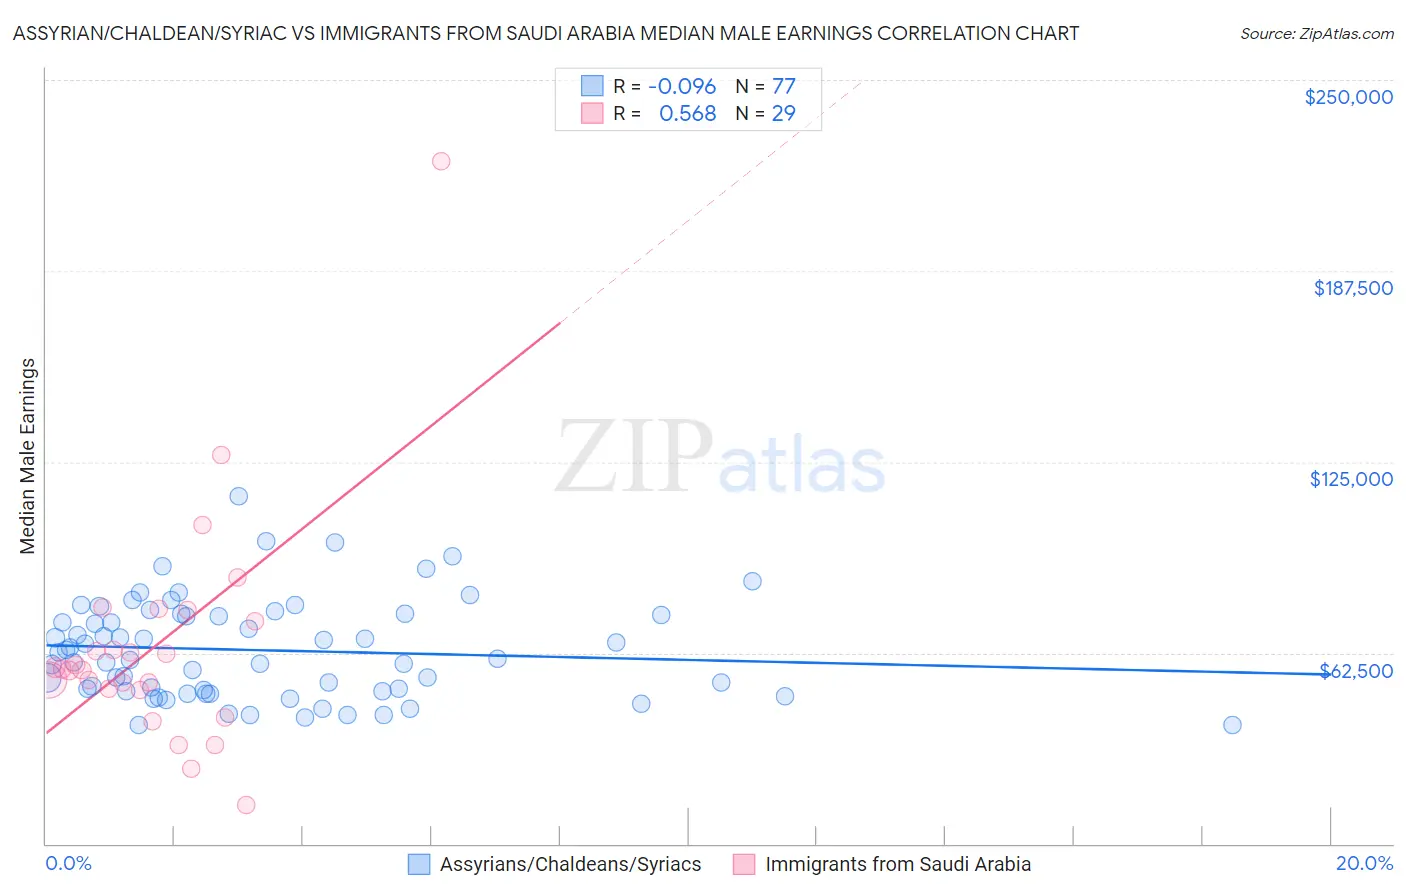
Assyrian/Chaldean/Syriac vs Immigrants from Saudi Arabia Median Male Earnings Correlation Chart
The statistical analysis conducted on geographies consisting of 110,268,457 people shows a slight negative correlation between the proportion of Assyrians/Chaldeans/Syriacs and median male earnings in the United States with a correlation coefficient (R) of -0.096 and weighted average of $58,437. Similarly, the statistical analysis conducted on geographies consisting of 164,293,936 people shows a substantial positive correlation between the proportion of Immigrants from Saudi Arabia and median male earnings in the United States with a correlation coefficient (R) of 0.568 and weighted average of $56,452, a difference of 3.5%.
Median Male Earnings Correlation Summary
| Measurement | Assyrian/Chaldean/Syriac | Immigrants from Saudi Arabia |
| Minimum | $38,990 | $12,696 |
| Maximum | $113,676 | $223,261 |
| Range | $74,686 | $210,565 |
| Mean | $63,347 | $64,851 |
| Median | $60,406 | $57,085 |
| Interquartile 25% (IQ1) | $49,882 | $50,362 |
| Interquartile 75% (IQ3) | $75,136 | $74,807 |
| Interquartile Range (IQR) | $25,254 | $24,445 |
| Standard Deviation (Sample) | $16,152 | $38,008 |
| Standard Deviation (Population) | $16,047 | $37,347 |
Similar Demographics by Median Male Earnings
Demographics Similar to Assyrians/Chaldeans/Syriacs by Median Male Earnings
In terms of median male earnings, the demographic groups most similar to Assyrians/Chaldeans/Syriacs are Immigrants from Poland ($58,452, a difference of 0.030%), Jordanian ($58,500, a difference of 0.11%), Immigrants from Brazil ($58,324, a difference of 0.19%), Northern European ($58,588, a difference of 0.26%), and Albanian ($58,680, a difference of 0.42%).
| Demographics | Rating | Rank | Median Male Earnings |
| Immigrants | Southern Europe | 99.0 /100 | #93 | Exceptional $59,217 |
| Immigrants | North Macedonia | 99.0 /100 | #94 | Exceptional $59,189 |
| Immigrants | Lebanon | 98.6 /100 | #95 | Exceptional $58,835 |
| Albanians | 98.4 /100 | #96 | Exceptional $58,680 |
| Northern Europeans | 98.2 /100 | #97 | Exceptional $58,588 |
| Jordanians | 98.1 /100 | #98 | Exceptional $58,500 |
| Immigrants | Poland | 98.0 /100 | #99 | Exceptional $58,452 |
| Assyrians/Chaldeans/Syriacs | 97.9 /100 | #100 | Exceptional $58,437 |
| Immigrants | Brazil | 97.7 /100 | #101 | Exceptional $58,324 |
| Syrians | 97.4 /100 | #102 | Exceptional $58,187 |
| Poles | 97.3 /100 | #103 | Exceptional $58,139 |
| Armenians | 97.3 /100 | #104 | Exceptional $58,134 |
| Immigrants | Western Asia | 97.3 /100 | #105 | Exceptional $58,131 |
| Immigrants | Northern Africa | 96.9 /100 | #106 | Exceptional $58,008 |
| Serbians | 96.8 /100 | #107 | Exceptional $57,975 |
Demographics Similar to Immigrants from Saudi Arabia by Median Male Earnings
In terms of median male earnings, the demographic groups most similar to Immigrants from Saudi Arabia are Irish ($56,464, a difference of 0.020%), Moroccan ($56,499, a difference of 0.080%), Slavic ($56,390, a difference of 0.11%), Immigrants from Germany ($56,542, a difference of 0.16%), and Czech ($56,546, a difference of 0.17%).
| Demographics | Rating | Rank | Median Male Earnings |
| Pakistanis | 89.9 /100 | #129 | Excellent $56,719 |
| Koreans | 89.4 /100 | #130 | Excellent $56,672 |
| Portuguese | 89.4 /100 | #131 | Excellent $56,663 |
| Czechs | 88.2 /100 | #132 | Excellent $56,546 |
| Immigrants | Germany | 88.2 /100 | #133 | Excellent $56,542 |
| Moroccans | 87.7 /100 | #134 | Excellent $56,499 |
| Irish | 87.4 /100 | #135 | Excellent $56,464 |
| Immigrants | Saudi Arabia | 87.2 /100 | #136 | Excellent $56,452 |
| Slavs | 86.5 /100 | #137 | Excellent $56,390 |
| Slovaks | 85.5 /100 | #138 | Excellent $56,306 |
| Zimbabweans | 85.5 /100 | #139 | Excellent $56,302 |
| Luxembourgers | 85.5 /100 | #140 | Excellent $56,300 |
| Danes | 84.8 /100 | #141 | Excellent $56,246 |
| Ethiopians | 84.8 /100 | #142 | Excellent $56,243 |
| Sri Lankans | 83.4 /100 | #143 | Excellent $56,136 |