Assyrian/Chaldean/Syriac vs Mongolian Median Male Earnings
COMPARE
Assyrian/Chaldean/Syriac
Mongolian
Median Male Earnings
Median Male Earnings Comparison
Assyrians/Chaldeans/Syriacs
Mongolians
$58,437
MEDIAN MALE EARNINGS
97.9/ 100
METRIC RATING
100th/ 347
METRIC RANK
$60,350
MEDIAN MALE EARNINGS
99.7/ 100
METRIC RATING
71st/ 347
METRIC RANK
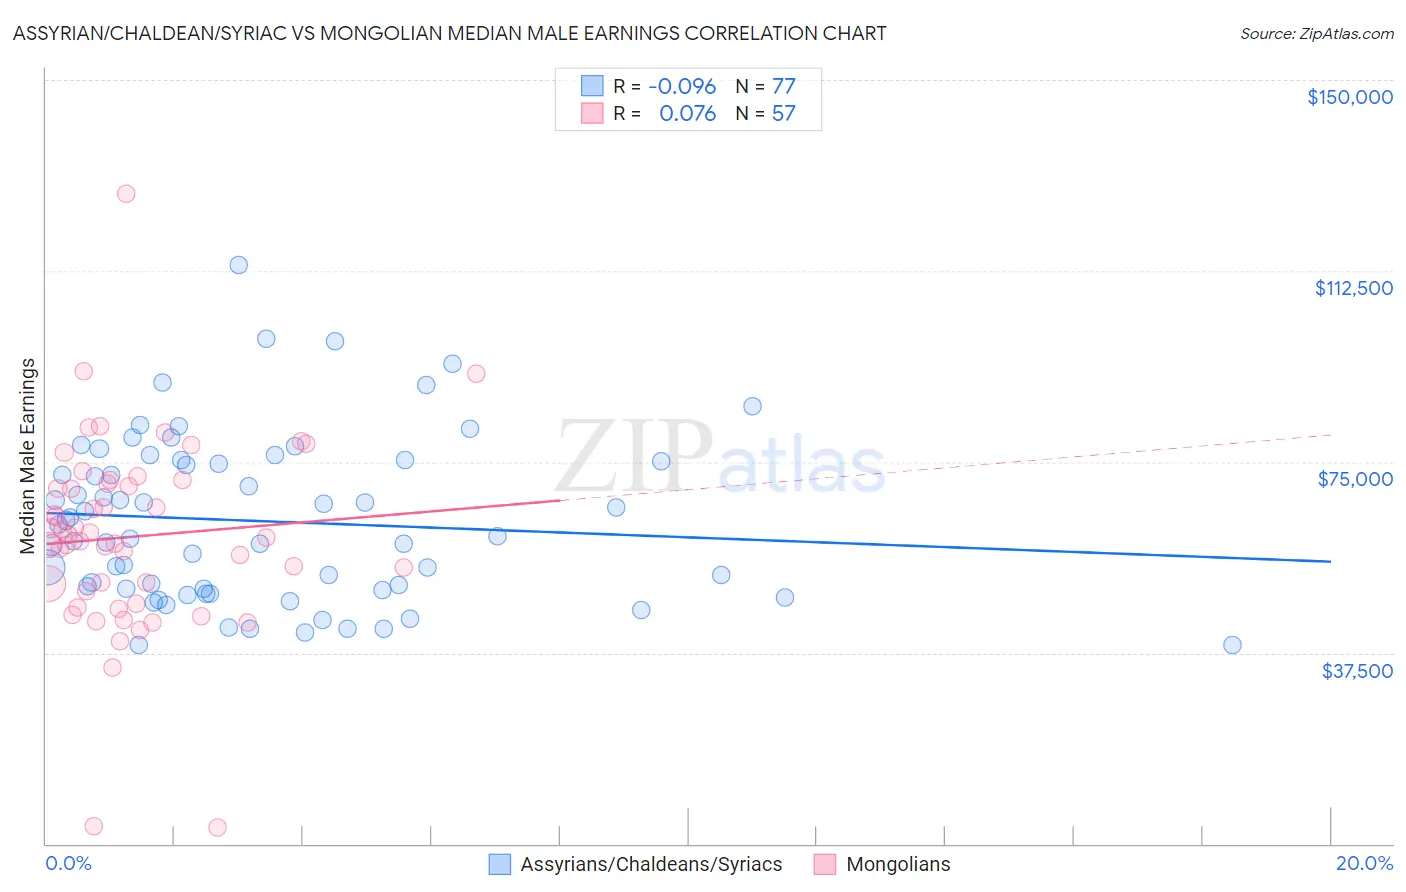
Assyrian/Chaldean/Syriac vs Mongolian Median Male Earnings Correlation Chart
The statistical analysis conducted on geographies consisting of 110,268,457 people shows a slight negative correlation between the proportion of Assyrians/Chaldeans/Syriacs and median male earnings in the United States with a correlation coefficient (R) of -0.096 and weighted average of $58,437. Similarly, the statistical analysis conducted on geographies consisting of 140,336,104 people shows a slight positive correlation between the proportion of Mongolians and median male earnings in the United States with a correlation coefficient (R) of 0.076 and weighted average of $60,350, a difference of 3.3%.
Median Male Earnings Correlation Summary
| Measurement | Assyrian/Chaldean/Syriac | Mongolian |
| Minimum | $38,990 | $3,109 |
| Maximum | $113,676 | $127,545 |
| Range | $74,686 | $124,436 |
| Mean | $63,347 | $60,323 |
| Median | $60,406 | $60,102 |
| Interquartile 25% (IQ1) | $49,882 | $48,308 |
| Interquartile 75% (IQ3) | $75,136 | $71,104 |
| Interquartile Range (IQR) | $25,254 | $22,796 |
| Standard Deviation (Sample) | $16,152 | $19,294 |
| Standard Deviation (Population) | $16,047 | $19,124 |
Similar Demographics by Median Male Earnings
Demographics Similar to Assyrians/Chaldeans/Syriacs by Median Male Earnings
In terms of median male earnings, the demographic groups most similar to Assyrians/Chaldeans/Syriacs are Immigrants from Poland ($58,452, a difference of 0.030%), Jordanian ($58,500, a difference of 0.11%), Immigrants from Brazil ($58,324, a difference of 0.19%), Northern European ($58,588, a difference of 0.26%), and Albanian ($58,680, a difference of 0.42%).
| Demographics | Rating | Rank | Median Male Earnings |
| Immigrants | Southern Europe | 99.0 /100 | #93 | Exceptional $59,217 |
| Immigrants | North Macedonia | 99.0 /100 | #94 | Exceptional $59,189 |
| Immigrants | Lebanon | 98.6 /100 | #95 | Exceptional $58,835 |
| Albanians | 98.4 /100 | #96 | Exceptional $58,680 |
| Northern Europeans | 98.2 /100 | #97 | Exceptional $58,588 |
| Jordanians | 98.1 /100 | #98 | Exceptional $58,500 |
| Immigrants | Poland | 98.0 /100 | #99 | Exceptional $58,452 |
| Assyrians/Chaldeans/Syriacs | 97.9 /100 | #100 | Exceptional $58,437 |
| Immigrants | Brazil | 97.7 /100 | #101 | Exceptional $58,324 |
| Syrians | 97.4 /100 | #102 | Exceptional $58,187 |
| Poles | 97.3 /100 | #103 | Exceptional $58,139 |
| Armenians | 97.3 /100 | #104 | Exceptional $58,134 |
| Immigrants | Western Asia | 97.3 /100 | #105 | Exceptional $58,131 |
| Immigrants | Northern Africa | 96.9 /100 | #106 | Exceptional $58,008 |
| Serbians | 96.8 /100 | #107 | Exceptional $57,975 |
Demographics Similar to Mongolians by Median Male Earnings
In terms of median male earnings, the demographic groups most similar to Mongolians are Immigrants from Bulgaria ($60,358, a difference of 0.010%), Immigrants from Western Europe ($60,334, a difference of 0.030%), Immigrants from Canada ($60,388, a difference of 0.060%), Immigrants from North America ($60,265, a difference of 0.14%), and Argentinean ($60,117, a difference of 0.39%).
| Demographics | Rating | Rank | Median Male Earnings |
| Immigrants | Eastern Europe | 99.8 /100 | #64 | Exceptional $60,958 |
| Immigrants | Indonesia | 99.8 /100 | #65 | Exceptional $60,935 |
| Immigrants | Croatia | 99.8 /100 | #66 | Exceptional $60,914 |
| Immigrants | Spain | 99.8 /100 | #67 | Exceptional $60,750 |
| Immigrants | Serbia | 99.7 /100 | #68 | Exceptional $60,600 |
| Immigrants | Canada | 99.7 /100 | #69 | Exceptional $60,388 |
| Immigrants | Bulgaria | 99.7 /100 | #70 | Exceptional $60,358 |
| Mongolians | 99.7 /100 | #71 | Exceptional $60,350 |
| Immigrants | Western Europe | 99.7 /100 | #72 | Exceptional $60,334 |
| Immigrants | North America | 99.7 /100 | #73 | Exceptional $60,265 |
| Argentineans | 99.6 /100 | #74 | Exceptional $60,117 |
| Immigrants | Bolivia | 99.6 /100 | #75 | Exceptional $60,088 |
| Romanians | 99.6 /100 | #76 | Exceptional $60,063 |
| Paraguayans | 99.5 /100 | #77 | Exceptional $59,975 |
| Immigrants | Egypt | 99.5 /100 | #78 | Exceptional $59,925 |