Assyrian/Chaldean/Syriac vs Indonesian Median Male Earnings
COMPARE
Assyrian/Chaldean/Syriac
Indonesian
Median Male Earnings
Median Male Earnings Comparison
Assyrians/Chaldeans/Syriacs
Indonesians
$58,437
MEDIAN MALE EARNINGS
97.9/ 100
METRIC RATING
100th/ 347
METRIC RANK
$47,503
MEDIAN MALE EARNINGS
0.1/ 100
METRIC RATING
293rd/ 347
METRIC RANK
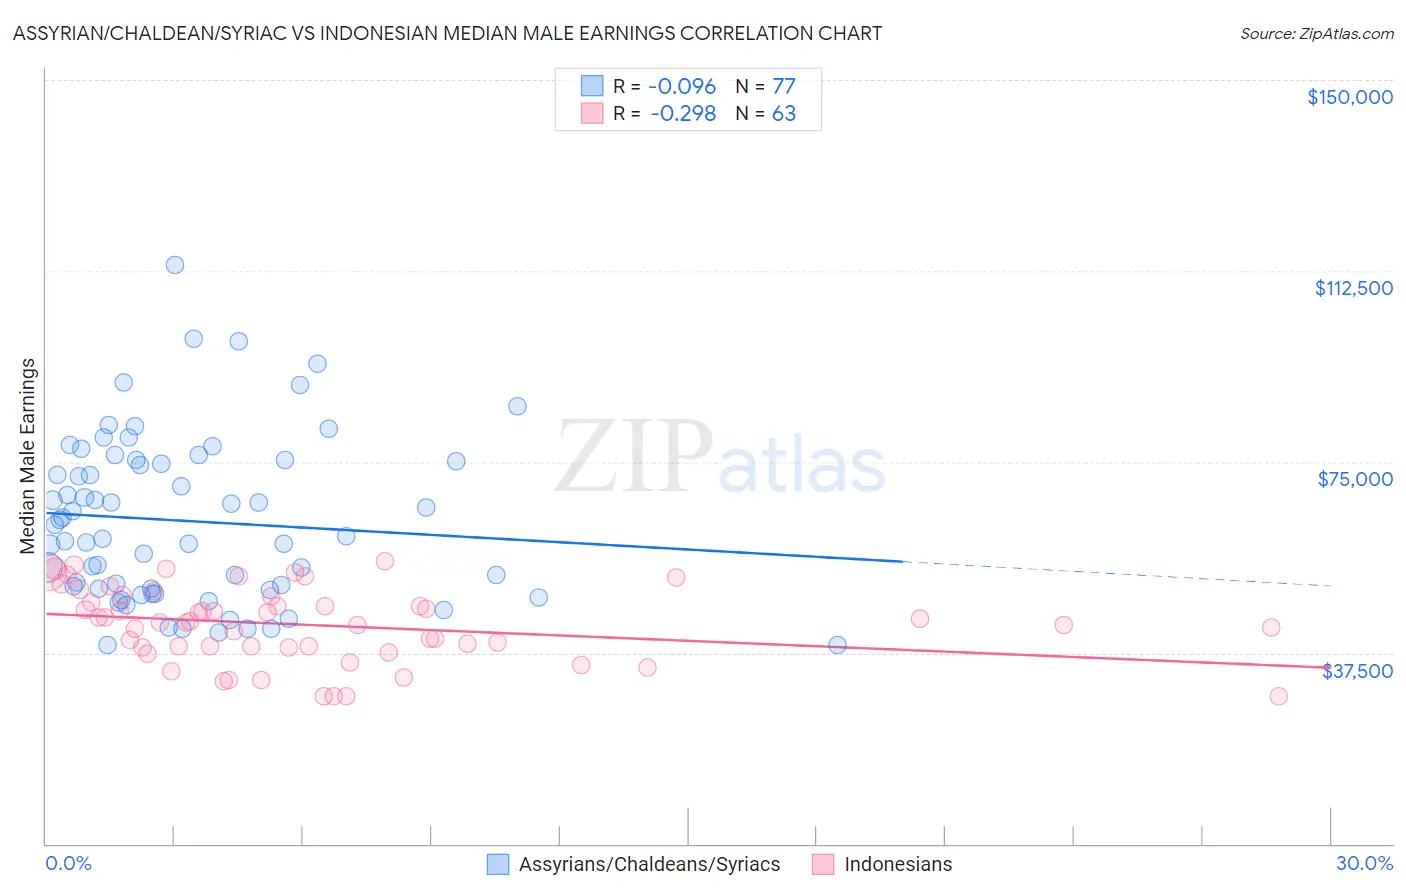
Assyrian/Chaldean/Syriac vs Indonesian Median Male Earnings Correlation Chart
The statistical analysis conducted on geographies consisting of 110,268,457 people shows a slight negative correlation between the proportion of Assyrians/Chaldeans/Syriacs and median male earnings in the United States with a correlation coefficient (R) of -0.096 and weighted average of $58,437. Similarly, the statistical analysis conducted on geographies consisting of 162,701,910 people shows a weak negative correlation between the proportion of Indonesians and median male earnings in the United States with a correlation coefficient (R) of -0.298 and weighted average of $47,503, a difference of 23.0%.
Median Male Earnings Correlation Summary
| Measurement | Assyrian/Chaldean/Syriac | Indonesian |
| Minimum | $38,990 | $28,857 |
| Maximum | $113,676 | $55,385 |
| Range | $74,686 | $26,528 |
| Mean | $63,347 | $42,970 |
| Median | $60,406 | $43,436 |
| Interquartile 25% (IQ1) | $49,882 | $38,534 |
| Interquartile 75% (IQ3) | $75,136 | $48,720 |
| Interquartile Range (IQR) | $25,254 | $10,186 |
| Standard Deviation (Sample) | $16,152 | $7,238 |
| Standard Deviation (Population) | $16,047 | $7,181 |
Similar Demographics by Median Male Earnings
Demographics Similar to Assyrians/Chaldeans/Syriacs by Median Male Earnings
In terms of median male earnings, the demographic groups most similar to Assyrians/Chaldeans/Syriacs are Immigrants from Poland ($58,452, a difference of 0.030%), Jordanian ($58,500, a difference of 0.11%), Immigrants from Brazil ($58,324, a difference of 0.19%), Northern European ($58,588, a difference of 0.26%), and Albanian ($58,680, a difference of 0.42%).
| Demographics | Rating | Rank | Median Male Earnings |
| Immigrants | Southern Europe | 99.0 /100 | #93 | Exceptional $59,217 |
| Immigrants | North Macedonia | 99.0 /100 | #94 | Exceptional $59,189 |
| Immigrants | Lebanon | 98.6 /100 | #95 | Exceptional $58,835 |
| Albanians | 98.4 /100 | #96 | Exceptional $58,680 |
| Northern Europeans | 98.2 /100 | #97 | Exceptional $58,588 |
| Jordanians | 98.1 /100 | #98 | Exceptional $58,500 |
| Immigrants | Poland | 98.0 /100 | #99 | Exceptional $58,452 |
| Assyrians/Chaldeans/Syriacs | 97.9 /100 | #100 | Exceptional $58,437 |
| Immigrants | Brazil | 97.7 /100 | #101 | Exceptional $58,324 |
| Syrians | 97.4 /100 | #102 | Exceptional $58,187 |
| Poles | 97.3 /100 | #103 | Exceptional $58,139 |
| Armenians | 97.3 /100 | #104 | Exceptional $58,134 |
| Immigrants | Western Asia | 97.3 /100 | #105 | Exceptional $58,131 |
| Immigrants | Northern Africa | 96.9 /100 | #106 | Exceptional $58,008 |
| Serbians | 96.8 /100 | #107 | Exceptional $57,975 |
Demographics Similar to Indonesians by Median Male Earnings
In terms of median male earnings, the demographic groups most similar to Indonesians are Immigrants from Nicaragua ($47,482, a difference of 0.040%), Central American Indian ($47,433, a difference of 0.15%), Immigrants from Dominica ($47,651, a difference of 0.31%), Inupiat ($47,281, a difference of 0.47%), and Choctaw ($47,729, a difference of 0.48%).
| Demographics | Rating | Rank | Median Male Earnings |
| Mexican American Indians | 0.2 /100 | #286 | Tragic $47,990 |
| Immigrants | El Salvador | 0.2 /100 | #287 | Tragic $47,973 |
| Shoshone | 0.2 /100 | #288 | Tragic $47,930 |
| Chickasaw | 0.1 /100 | #289 | Tragic $47,832 |
| Immigrants | Belize | 0.1 /100 | #290 | Tragic $47,809 |
| Choctaw | 0.1 /100 | #291 | Tragic $47,729 |
| Immigrants | Dominica | 0.1 /100 | #292 | Tragic $47,651 |
| Indonesians | 0.1 /100 | #293 | Tragic $47,503 |
| Immigrants | Nicaragua | 0.1 /100 | #294 | Tragic $47,482 |
| Central American Indians | 0.1 /100 | #295 | Tragic $47,433 |
| Inupiat | 0.1 /100 | #296 | Tragic $47,281 |
| Dominicans | 0.1 /100 | #297 | Tragic $47,204 |
| Immigrants | Micronesia | 0.1 /100 | #298 | Tragic $47,177 |
| Immigrants | Zaire | 0.1 /100 | #299 | Tragic $47,070 |
| U.S. Virgin Islanders | 0.1 /100 | #300 | Tragic $47,066 |