Trinidadian and Tobagonian vs Chickasaw Per Capita Income
COMPARE
Trinidadian and Tobagonian
Chickasaw
Per Capita Income
Per Capita Income Comparison
Trinidadians and Tobagonians
Chickasaw
$41,655
PER CAPITA INCOME
9.5/ 100
METRIC RATING
218th/ 347
METRIC RANK
$36,475
PER CAPITA INCOME
0.0/ 100
METRIC RATING
312th/ 347
METRIC RANK
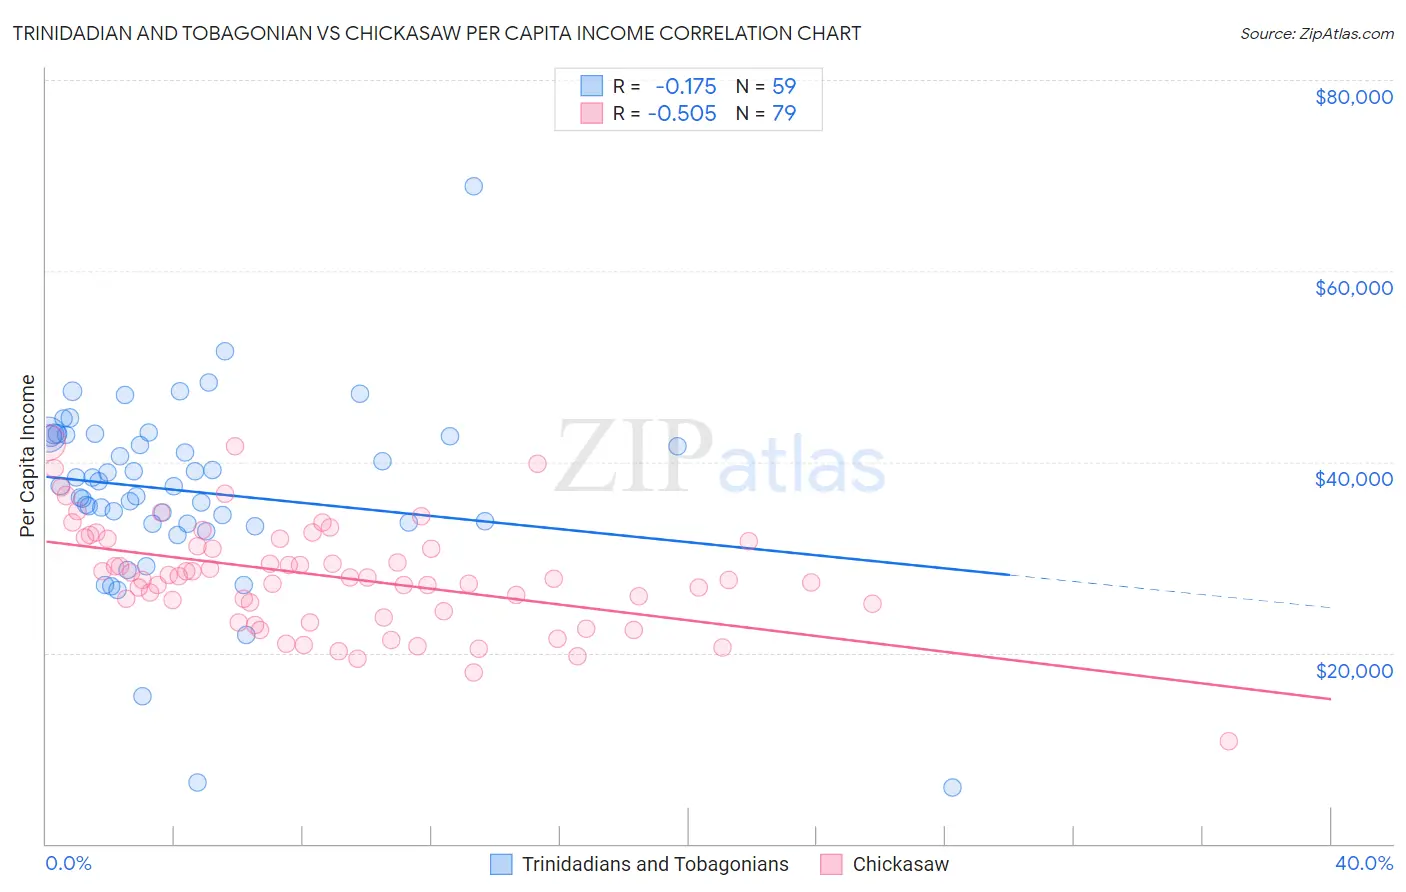
Trinidadian and Tobagonian vs Chickasaw Per Capita Income Correlation Chart
The statistical analysis conducted on geographies consisting of 219,889,978 people shows a poor negative correlation between the proportion of Trinidadians and Tobagonians and per capita income in the United States with a correlation coefficient (R) of -0.175 and weighted average of $41,655. Similarly, the statistical analysis conducted on geographies consisting of 147,726,791 people shows a substantial negative correlation between the proportion of Chickasaw and per capita income in the United States with a correlation coefficient (R) of -0.505 and weighted average of $36,475, a difference of 14.2%.
Per Capita Income Correlation Summary
| Measurement | Trinidadian and Tobagonian | Chickasaw |
| Minimum | $5,914 | $10,758 |
| Maximum | $68,888 | $42,047 |
| Range | $62,974 | $31,289 |
| Mean | $36,934 | $28,009 |
| Median | $37,494 | $27,826 |
| Interquartile 25% (IQ1) | $33,546 | $24,362 |
| Interquartile 75% (IQ3) | $42,786 | $31,977 |
| Interquartile Range (IQR) | $9,240 | $7,616 |
| Standard Deviation (Sample) | $9,761 | $5,659 |
| Standard Deviation (Population) | $9,678 | $5,624 |
Similar Demographics by Per Capita Income
Demographics Similar to Trinidadians and Tobagonians by Per Capita Income
In terms of per capita income, the demographic groups most similar to Trinidadians and Tobagonians are Guamanian/Chamorro ($41,678, a difference of 0.060%), Tongan ($41,693, a difference of 0.090%), Sudanese ($41,695, a difference of 0.10%), Immigrants from Bangladesh ($41,709, a difference of 0.13%), and Immigrants from Venezuela ($41,727, a difference of 0.17%).
| Demographics | Rating | Rank | Per Capita Income |
| Immigrants | Panama | 11.6 /100 | #211 | Poor $41,853 |
| Immigrants | Senegal | 11.3 /100 | #212 | Poor $41,830 |
| Immigrants | Venezuela | 10.2 /100 | #213 | Poor $41,727 |
| Immigrants | Bangladesh | 10.1 /100 | #214 | Poor $41,709 |
| Sudanese | 9.9 /100 | #215 | Tragic $41,695 |
| Tongans | 9.9 /100 | #216 | Tragic $41,693 |
| Guamanians/Chamorros | 9.7 /100 | #217 | Tragic $41,678 |
| Trinidadians and Tobagonians | 9.5 /100 | #218 | Tragic $41,655 |
| Puget Sound Salish | 8.1 /100 | #219 | Tragic $41,495 |
| Immigrants | Barbados | 7.9 /100 | #220 | Tragic $41,478 |
| Immigrants | Trinidad and Tobago | 7.9 /100 | #221 | Tragic $41,476 |
| Immigrants | Iraq | 7.1 /100 | #222 | Tragic $41,365 |
| Immigrants | Cameroon | 6.8 /100 | #223 | Tragic $41,334 |
| Immigrants | St. Vincent and the Grenadines | 6.4 /100 | #224 | Tragic $41,270 |
| West Indians | 6.0 /100 | #225 | Tragic $41,217 |
Demographics Similar to Chickasaw by Per Capita Income
In terms of per capita income, the demographic groups most similar to Chickasaw are Bahamian ($36,427, a difference of 0.13%), Chippewa ($36,631, a difference of 0.43%), Ute ($36,651, a difference of 0.48%), Immigrants from Honduras ($36,665, a difference of 0.52%), and Fijian ($36,690, a difference of 0.59%).
| Demographics | Rating | Rank | Per Capita Income |
| Inupiat | 0.1 /100 | #305 | Tragic $36,999 |
| Immigrants | Haiti | 0.0 /100 | #306 | Tragic $36,849 |
| Immigrants | Latin America | 0.0 /100 | #307 | Tragic $36,823 |
| Fijians | 0.0 /100 | #308 | Tragic $36,690 |
| Immigrants | Honduras | 0.0 /100 | #309 | Tragic $36,665 |
| Ute | 0.0 /100 | #310 | Tragic $36,651 |
| Chippewa | 0.0 /100 | #311 | Tragic $36,631 |
| Chickasaw | 0.0 /100 | #312 | Tragic $36,475 |
| Bahamians | 0.0 /100 | #313 | Tragic $36,427 |
| Seminole | 0.0 /100 | #314 | Tragic $36,180 |
| Yaqui | 0.0 /100 | #315 | Tragic $36,112 |
| Choctaw | 0.0 /100 | #316 | Tragic $35,999 |
| Dutch West Indians | 0.0 /100 | #317 | Tragic $35,922 |
| Bangladeshis | 0.0 /100 | #318 | Tragic $35,897 |
| Immigrants | Congo | 0.0 /100 | #319 | Tragic $35,720 |