Trinidadian and Tobagonian vs Alsatian Per Capita Income
COMPARE
Trinidadian and Tobagonian
Alsatian
Per Capita Income
Per Capita Income Comparison
Trinidadians and Tobagonians
Alsatians
$41,655
PER CAPITA INCOME
9.5/ 100
METRIC RATING
218th/ 347
METRIC RANK
$47,284
PER CAPITA INCOME
98.3/ 100
METRIC RATING
96th/ 347
METRIC RANK
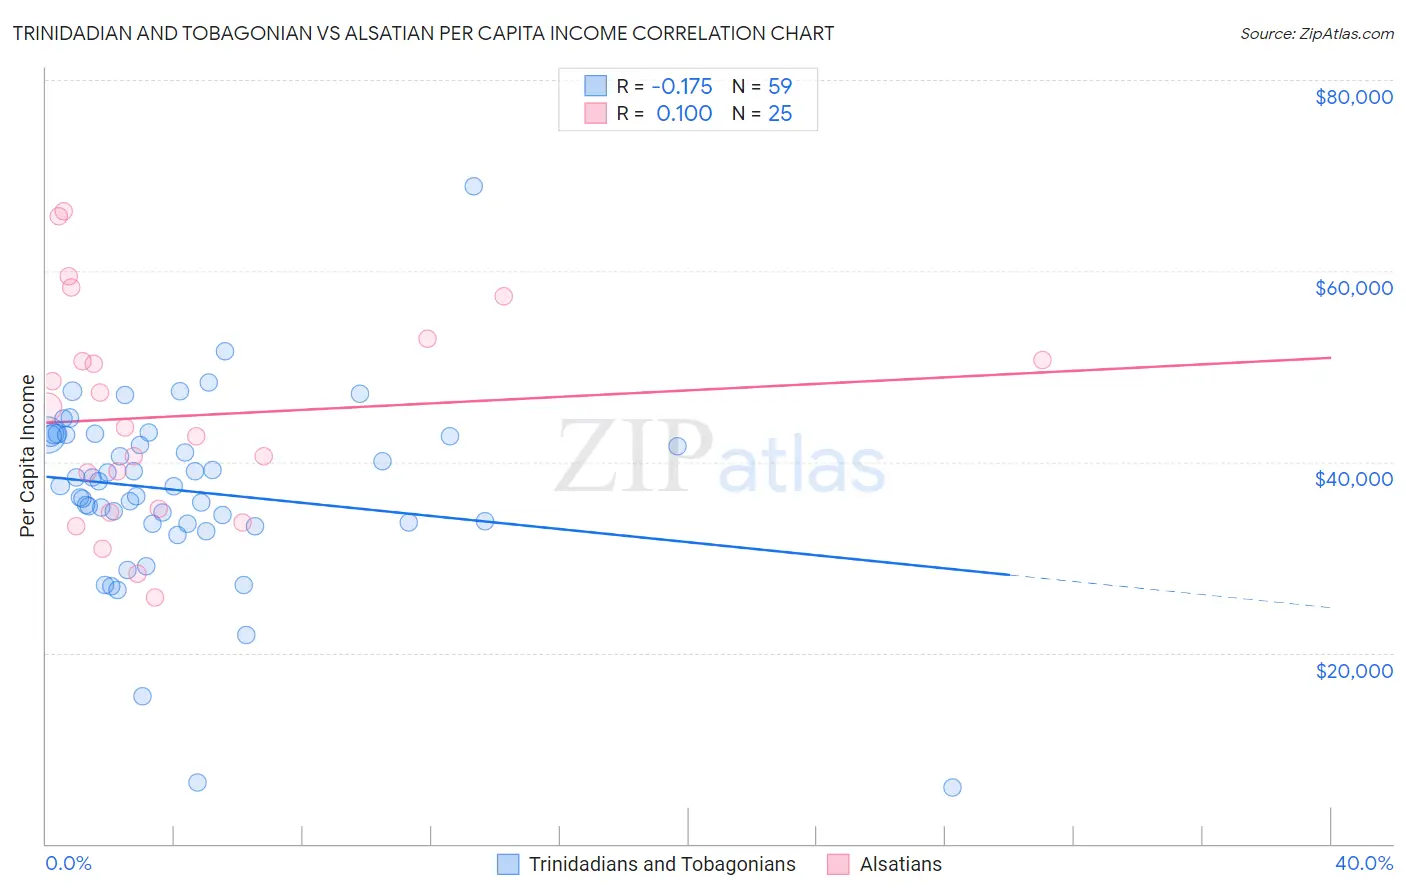
Trinidadian and Tobagonian vs Alsatian Per Capita Income Correlation Chart
The statistical analysis conducted on geographies consisting of 219,889,978 people shows a poor negative correlation between the proportion of Trinidadians and Tobagonians and per capita income in the United States with a correlation coefficient (R) of -0.175 and weighted average of $41,655. Similarly, the statistical analysis conducted on geographies consisting of 82,682,365 people shows a slight positive correlation between the proportion of Alsatians and per capita income in the United States with a correlation coefficient (R) of 0.100 and weighted average of $47,284, a difference of 13.5%.
Per Capita Income Correlation Summary
| Measurement | Trinidadian and Tobagonian | Alsatian |
| Minimum | $5,914 | $25,853 |
| Maximum | $68,888 | $66,221 |
| Range | $62,974 | $40,368 |
| Mean | $36,934 | $44,810 |
| Median | $37,494 | $43,610 |
| Interquartile 25% (IQ1) | $33,546 | $34,894 |
| Interquartile 75% (IQ3) | $42,786 | $51,799 |
| Interquartile Range (IQR) | $9,240 | $16,905 |
| Standard Deviation (Sample) | $9,761 | $11,224 |
| Standard Deviation (Population) | $9,678 | $10,998 |
Similar Demographics by Per Capita Income
Demographics Similar to Trinidadians and Tobagonians by Per Capita Income
In terms of per capita income, the demographic groups most similar to Trinidadians and Tobagonians are Guamanian/Chamorro ($41,678, a difference of 0.060%), Tongan ($41,693, a difference of 0.090%), Sudanese ($41,695, a difference of 0.10%), Immigrants from Bangladesh ($41,709, a difference of 0.13%), and Immigrants from Venezuela ($41,727, a difference of 0.17%).
| Demographics | Rating | Rank | Per Capita Income |
| Immigrants | Panama | 11.6 /100 | #211 | Poor $41,853 |
| Immigrants | Senegal | 11.3 /100 | #212 | Poor $41,830 |
| Immigrants | Venezuela | 10.2 /100 | #213 | Poor $41,727 |
| Immigrants | Bangladesh | 10.1 /100 | #214 | Poor $41,709 |
| Sudanese | 9.9 /100 | #215 | Tragic $41,695 |
| Tongans | 9.9 /100 | #216 | Tragic $41,693 |
| Guamanians/Chamorros | 9.7 /100 | #217 | Tragic $41,678 |
| Trinidadians and Tobagonians | 9.5 /100 | #218 | Tragic $41,655 |
| Puget Sound Salish | 8.1 /100 | #219 | Tragic $41,495 |
| Immigrants | Barbados | 7.9 /100 | #220 | Tragic $41,478 |
| Immigrants | Trinidad and Tobago | 7.9 /100 | #221 | Tragic $41,476 |
| Immigrants | Iraq | 7.1 /100 | #222 | Tragic $41,365 |
| Immigrants | Cameroon | 6.8 /100 | #223 | Tragic $41,334 |
| Immigrants | St. Vincent and the Grenadines | 6.4 /100 | #224 | Tragic $41,270 |
| West Indians | 6.0 /100 | #225 | Tragic $41,217 |
Demographics Similar to Alsatians by Per Capita Income
In terms of per capita income, the demographic groups most similar to Alsatians are Carpatho Rusyn ($47,248, a difference of 0.080%), Immigrants from Egypt ($47,361, a difference of 0.16%), Albanian ($47,379, a difference of 0.20%), Immigrants from Zimbabwe ($47,394, a difference of 0.23%), and Immigrants from Moldova ($47,489, a difference of 0.43%).
| Demographics | Rating | Rank | Per Capita Income |
| Northern Europeans | 98.9 /100 | #89 | Exceptional $47,698 |
| Italians | 98.8 /100 | #90 | Exceptional $47,574 |
| Macedonians | 98.8 /100 | #91 | Exceptional $47,573 |
| Immigrants | Moldova | 98.7 /100 | #92 | Exceptional $47,489 |
| Immigrants | Zimbabwe | 98.5 /100 | #93 | Exceptional $47,394 |
| Albanians | 98.5 /100 | #94 | Exceptional $47,379 |
| Immigrants | Egypt | 98.5 /100 | #95 | Exceptional $47,361 |
| Alsatians | 98.3 /100 | #96 | Exceptional $47,284 |
| Carpatho Rusyns | 98.2 /100 | #97 | Exceptional $47,248 |
| Immigrants | Pakistan | 97.9 /100 | #98 | Exceptional $47,084 |
| Laotians | 97.8 /100 | #99 | Exceptional $47,041 |
| Immigrants | Lebanon | 97.5 /100 | #100 | Exceptional $46,938 |
| Immigrants | Uzbekistan | 97.5 /100 | #101 | Exceptional $46,929 |
| Immigrants | Western Asia | 97.4 /100 | #102 | Exceptional $46,876 |
| Syrians | 97.2 /100 | #103 | Exceptional $46,837 |