Trinidadian and Tobagonian vs Somali Per Capita Income
COMPARE
Trinidadian and Tobagonian
Somali
Per Capita Income
Per Capita Income Comparison
Trinidadians and Tobagonians
Somalis
$41,655
PER CAPITA INCOME
9.5/ 100
METRIC RATING
218th/ 347
METRIC RANK
$40,367
PER CAPITA INCOME
2.4/ 100
METRIC RATING
238th/ 347
METRIC RANK
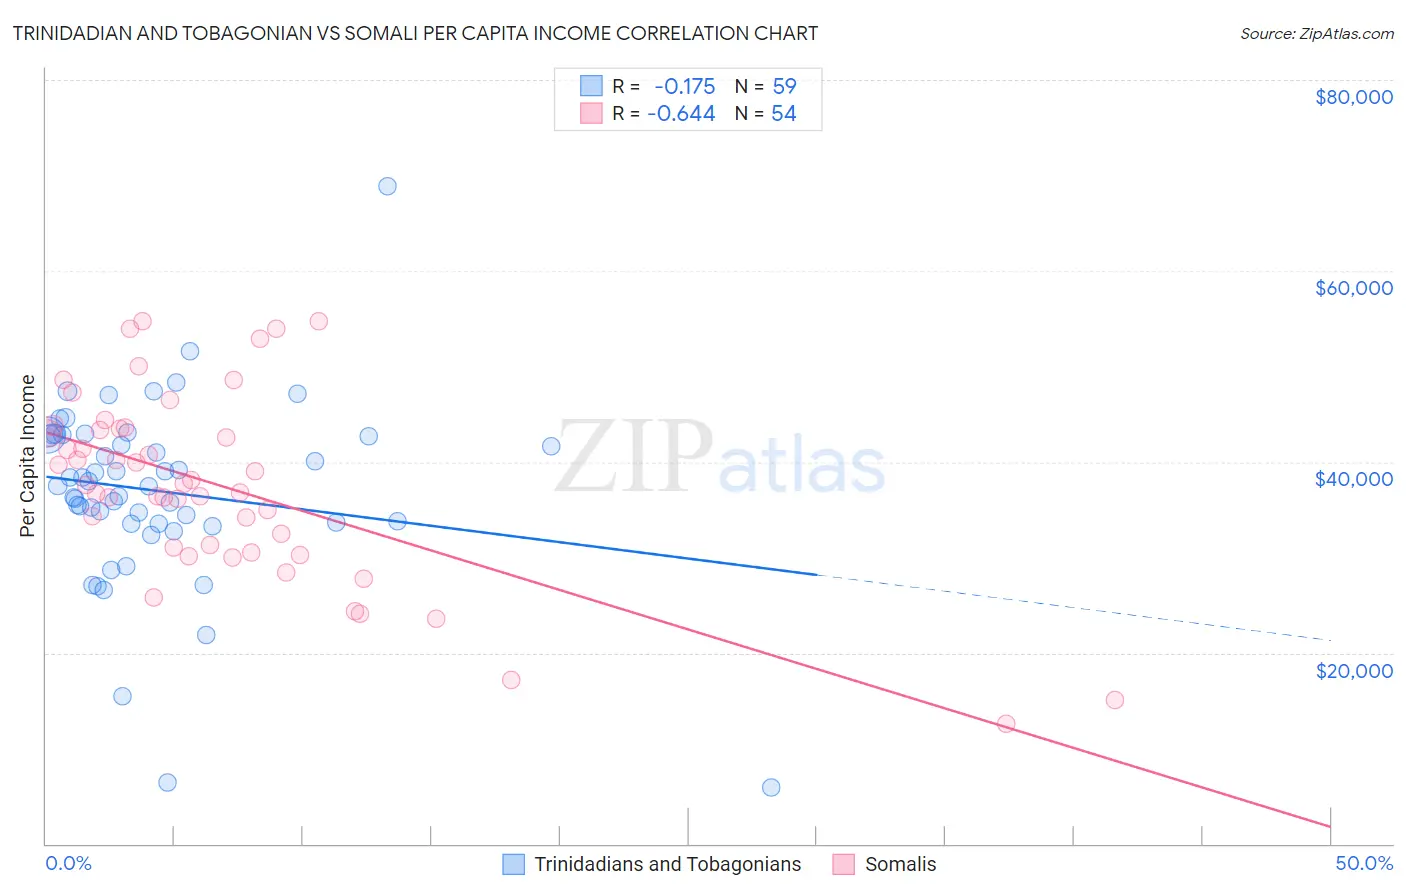
Trinidadian and Tobagonian vs Somali Per Capita Income Correlation Chart
The statistical analysis conducted on geographies consisting of 219,889,978 people shows a poor negative correlation between the proportion of Trinidadians and Tobagonians and per capita income in the United States with a correlation coefficient (R) of -0.175 and weighted average of $41,655. Similarly, the statistical analysis conducted on geographies consisting of 99,334,522 people shows a significant negative correlation between the proportion of Somalis and per capita income in the United States with a correlation coefficient (R) of -0.644 and weighted average of $40,367, a difference of 3.2%.
Per Capita Income Correlation Summary
| Measurement | Trinidadian and Tobagonian | Somali |
| Minimum | $5,914 | $12,576 |
| Maximum | $68,888 | $54,740 |
| Range | $62,974 | $42,164 |
| Mean | $36,934 | $37,481 |
| Median | $37,494 | $37,654 |
| Interquartile 25% (IQ1) | $33,546 | $31,050 |
| Interquartile 75% (IQ3) | $42,786 | $43,455 |
| Interquartile Range (IQR) | $9,240 | $12,404 |
| Standard Deviation (Sample) | $9,761 | $9,737 |
| Standard Deviation (Population) | $9,678 | $9,647 |
Demographics Similar to Trinidadians and Tobagonians and Somalis by Per Capita Income
In terms of per capita income, the demographic groups most similar to Trinidadians and Tobagonians are Puget Sound Salish ($41,495, a difference of 0.39%), Immigrants from Barbados ($41,478, a difference of 0.43%), Immigrants from Trinidad and Tobago ($41,476, a difference of 0.43%), Immigrants from Iraq ($41,365, a difference of 0.70%), and Immigrants from Cameroon ($41,334, a difference of 0.78%). Similarly, the demographic groups most similar to Somalis are Immigrants from Cambodia ($40,434, a difference of 0.16%), Nonimmigrants ($40,669, a difference of 0.75%), Immigrants from Guyana ($40,742, a difference of 0.93%), Immigrants from West Indies ($40,763, a difference of 0.98%), and Delaware ($40,778, a difference of 1.0%).
| Demographics | Rating | Rank | Per Capita Income |
| Trinidadians and Tobagonians | 9.5 /100 | #218 | Tragic $41,655 |
| Puget Sound Salish | 8.1 /100 | #219 | Tragic $41,495 |
| Immigrants | Barbados | 7.9 /100 | #220 | Tragic $41,478 |
| Immigrants | Trinidad and Tobago | 7.9 /100 | #221 | Tragic $41,476 |
| Immigrants | Iraq | 7.1 /100 | #222 | Tragic $41,365 |
| Immigrants | Cameroon | 6.8 /100 | #223 | Tragic $41,334 |
| Immigrants | St. Vincent and the Grenadines | 6.4 /100 | #224 | Tragic $41,270 |
| West Indians | 6.0 /100 | #225 | Tragic $41,217 |
| Immigrants | Ecuador | 5.9 /100 | #226 | Tragic $41,195 |
| Immigrants | Ghana | 5.5 /100 | #227 | Tragic $41,131 |
| Immigrants | Grenada | 5.5 /100 | #228 | Tragic $41,123 |
| Nigerians | 4.9 /100 | #229 | Tragic $41,026 |
| Native Hawaiians | 4.9 /100 | #230 | Tragic $41,017 |
| Senegalese | 4.8 /100 | #231 | Tragic $41,000 |
| Guyanese | 4.5 /100 | #232 | Tragic $40,949 |
| Delaware | 3.8 /100 | #233 | Tragic $40,778 |
| Immigrants | West Indies | 3.7 /100 | #234 | Tragic $40,763 |
| Immigrants | Guyana | 3.6 /100 | #235 | Tragic $40,742 |
| Immigrants | Nonimmigrants | 3.4 /100 | #236 | Tragic $40,669 |
| Immigrants | Cambodia | 2.6 /100 | #237 | Tragic $40,434 |
| Somalis | 2.4 /100 | #238 | Tragic $40,367 |