Immigrants from Mexico vs Chickasaw Per Capita Income
COMPARE
Immigrants from Mexico
Chickasaw
Per Capita Income
Per Capita Income Comparison
Immigrants from Mexico
Chickasaw
$33,931
PER CAPITA INCOME
0.0/ 100
METRIC RATING
331st/ 347
METRIC RANK
$36,475
PER CAPITA INCOME
0.0/ 100
METRIC RATING
312th/ 347
METRIC RANK
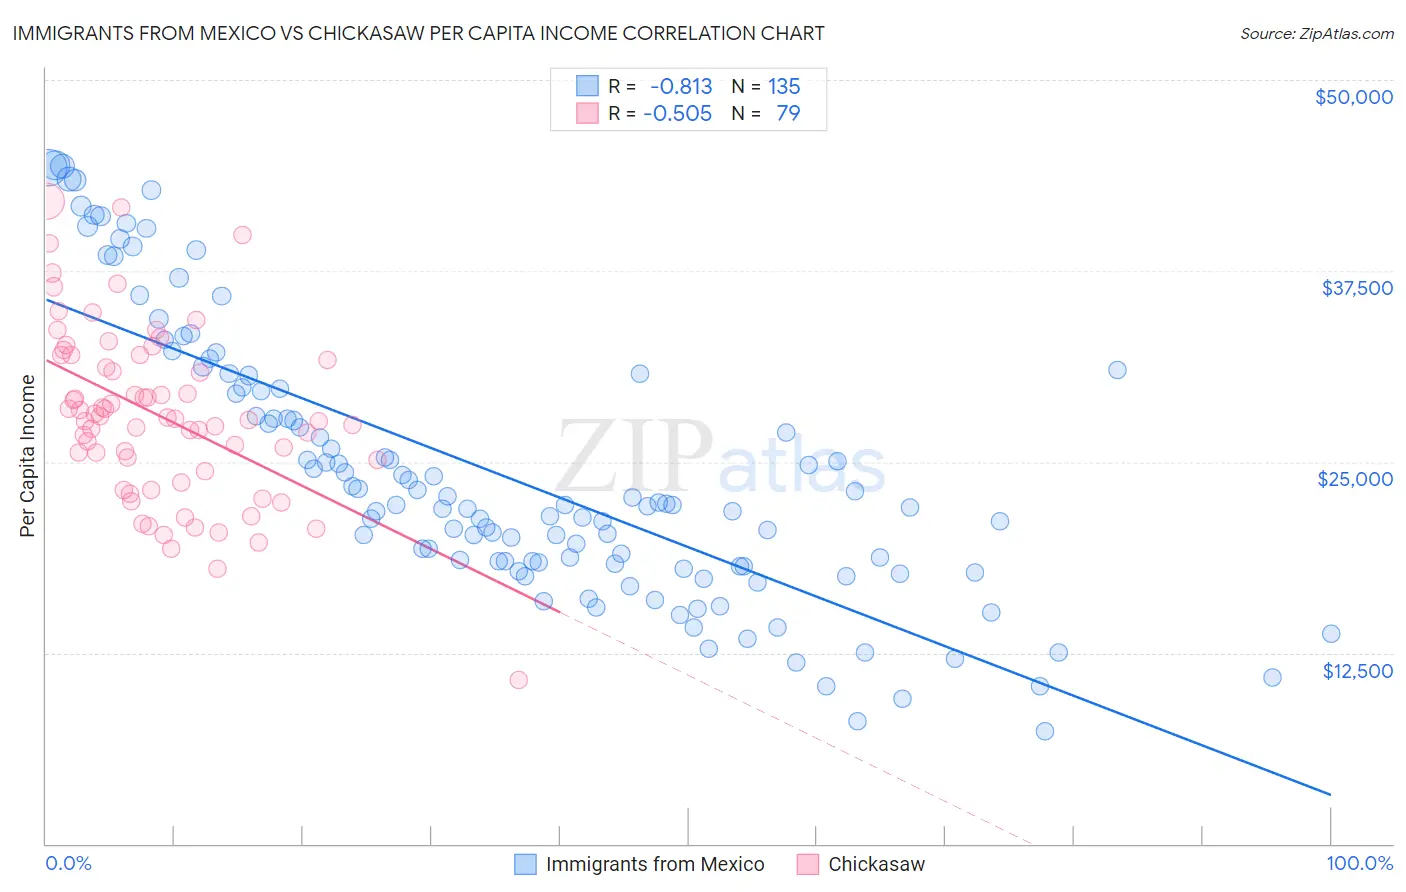
Immigrants from Mexico vs Chickasaw Per Capita Income Correlation Chart
The statistical analysis conducted on geographies consisting of 513,776,249 people shows a very strong negative correlation between the proportion of Immigrants from Mexico and per capita income in the United States with a correlation coefficient (R) of -0.813 and weighted average of $33,931. Similarly, the statistical analysis conducted on geographies consisting of 147,726,791 people shows a substantial negative correlation between the proportion of Chickasaw and per capita income in the United States with a correlation coefficient (R) of -0.505 and weighted average of $36,475, a difference of 7.5%.
Per Capita Income Correlation Summary
| Measurement | Immigrants from Mexico | Chickasaw |
| Minimum | $7,365 | $10,758 |
| Maximum | $44,424 | $42,047 |
| Range | $37,059 | $31,289 |
| Mean | $24,192 | $28,009 |
| Median | $22,163 | $27,826 |
| Interquartile 25% (IQ1) | $18,195 | $24,362 |
| Interquartile 75% (IQ3) | $29,815 | $31,977 |
| Interquartile Range (IQR) | $11,620 | $7,616 |
| Standard Deviation (Sample) | $8,892 | $5,659 |
| Standard Deviation (Population) | $8,859 | $5,624 |
Demographics Similar to Immigrants from Mexico and Chickasaw by Per Capita Income
In terms of per capita income, the demographic groups most similar to Immigrants from Mexico are Spanish American Indian ($34,195, a difference of 0.78%), Mexican ($34,559, a difference of 1.8%), Menominee ($34,578, a difference of 1.9%), Apache ($34,886, a difference of 2.8%), and Immigrants from Cuba ($34,910, a difference of 2.9%). Similarly, the demographic groups most similar to Chickasaw are Bahamian ($36,427, a difference of 0.13%), Chippewa ($36,631, a difference of 0.43%), Seminole ($36,180, a difference of 0.81%), Yaqui ($36,112, a difference of 1.0%), and Choctaw ($35,999, a difference of 1.3%).
| Demographics | Rating | Rank | Per Capita Income |
| Chippewa | 0.0 /100 | #311 | Tragic $36,631 |
| Chickasaw | 0.0 /100 | #312 | Tragic $36,475 |
| Bahamians | 0.0 /100 | #313 | Tragic $36,427 |
| Seminole | 0.0 /100 | #314 | Tragic $36,180 |
| Yaqui | 0.0 /100 | #315 | Tragic $36,112 |
| Choctaw | 0.0 /100 | #316 | Tragic $35,999 |
| Dutch West Indians | 0.0 /100 | #317 | Tragic $35,922 |
| Bangladeshis | 0.0 /100 | #318 | Tragic $35,897 |
| Immigrants | Congo | 0.0 /100 | #319 | Tragic $35,720 |
| Hispanics or Latinos | 0.0 /100 | #320 | Tragic $35,688 |
| Blacks/African Americans | 0.0 /100 | #321 | Tragic $35,564 |
| Creek | 0.0 /100 | #322 | Tragic $35,546 |
| Cheyenne | 0.0 /100 | #323 | Tragic $35,276 |
| Kiowa | 0.0 /100 | #324 | Tragic $35,102 |
| Immigrants | Central America | 0.0 /100 | #325 | Tragic $34,974 |
| Immigrants | Cuba | 0.0 /100 | #326 | Tragic $34,910 |
| Apache | 0.0 /100 | #327 | Tragic $34,886 |
| Menominee | 0.0 /100 | #328 | Tragic $34,578 |
| Mexicans | 0.0 /100 | #329 | Tragic $34,559 |
| Spanish American Indians | 0.0 /100 | #330 | Tragic $34,195 |
| Immigrants | Mexico | 0.0 /100 | #331 | Tragic $33,931 |