Trinidadian and Tobagonian vs Immigrants from Italy Per Capita Income
COMPARE
Trinidadian and Tobagonian
Immigrants from Italy
Per Capita Income
Per Capita Income Comparison
Trinidadians and Tobagonians
Immigrants from Italy
$41,655
PER CAPITA INCOME
9.5/ 100
METRIC RATING
218th/ 347
METRIC RANK
$48,654
PER CAPITA INCOME
99.6/ 100
METRIC RATING
78th/ 347
METRIC RANK
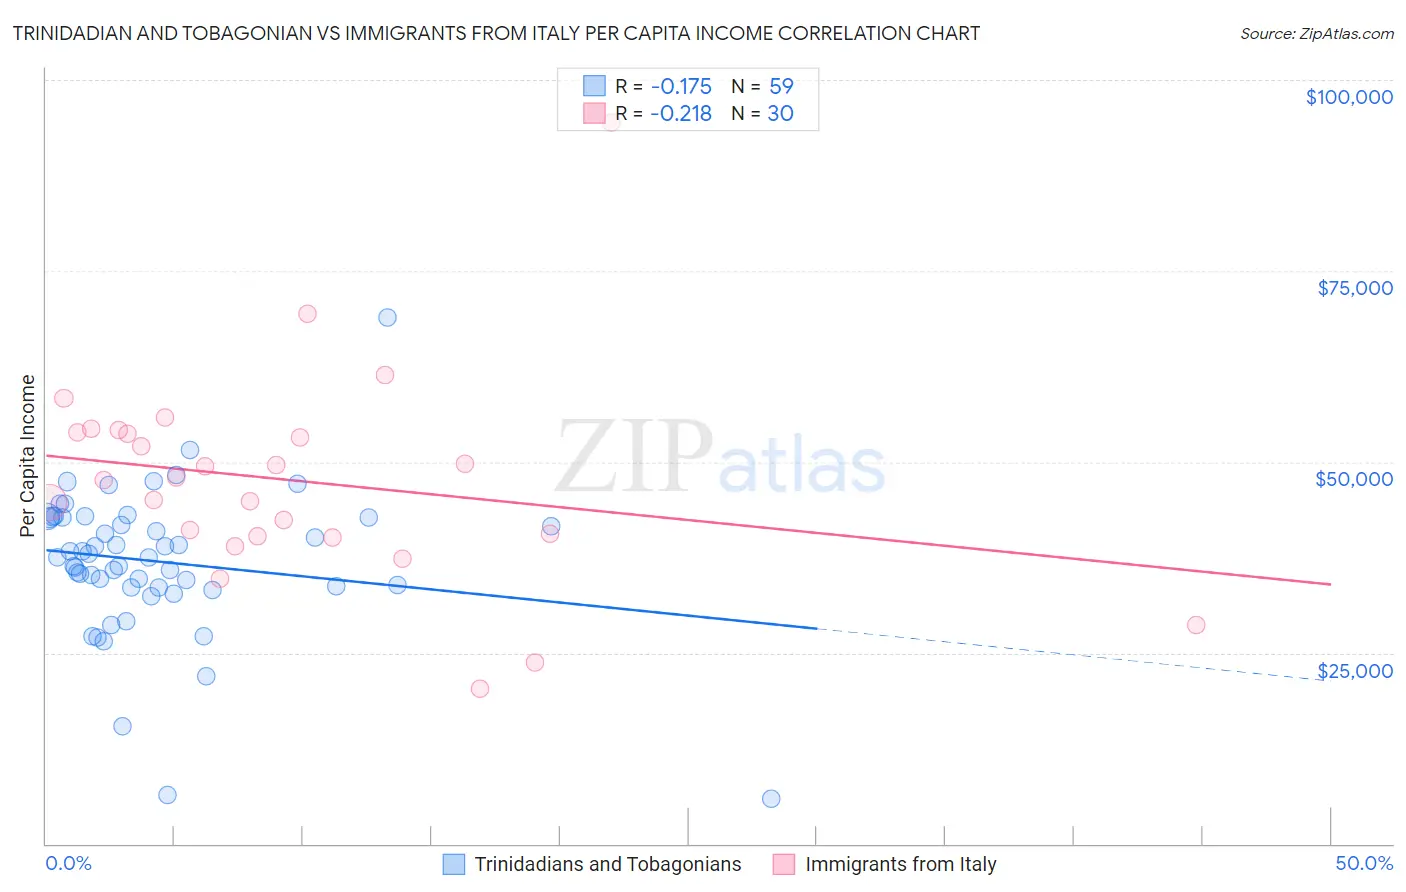
Trinidadian and Tobagonian vs Immigrants from Italy Per Capita Income Correlation Chart
The statistical analysis conducted on geographies consisting of 219,889,978 people shows a poor negative correlation between the proportion of Trinidadians and Tobagonians and per capita income in the United States with a correlation coefficient (R) of -0.175 and weighted average of $41,655. Similarly, the statistical analysis conducted on geographies consisting of 324,225,966 people shows a weak negative correlation between the proportion of Immigrants from Italy and per capita income in the United States with a correlation coefficient (R) of -0.218 and weighted average of $48,654, a difference of 16.8%.
Per Capita Income Correlation Summary
| Measurement | Trinidadian and Tobagonian | Immigrants from Italy |
| Minimum | $5,914 | $20,264 |
| Maximum | $68,888 | $94,379 |
| Range | $62,974 | $74,115 |
| Mean | $36,934 | $47,589 |
| Median | $37,494 | $47,756 |
| Interquartile 25% (IQ1) | $33,546 | $40,312 |
| Interquartile 75% (IQ3) | $42,786 | $53,919 |
| Interquartile Range (IQR) | $9,240 | $13,607 |
| Standard Deviation (Sample) | $9,761 | $13,819 |
| Standard Deviation (Population) | $9,678 | $13,587 |
Similar Demographics by Per Capita Income
Demographics Similar to Trinidadians and Tobagonians by Per Capita Income
In terms of per capita income, the demographic groups most similar to Trinidadians and Tobagonians are Guamanian/Chamorro ($41,678, a difference of 0.060%), Tongan ($41,693, a difference of 0.090%), Sudanese ($41,695, a difference of 0.10%), Immigrants from Bangladesh ($41,709, a difference of 0.13%), and Immigrants from Venezuela ($41,727, a difference of 0.17%).
| Demographics | Rating | Rank | Per Capita Income |
| Immigrants | Panama | 11.6 /100 | #211 | Poor $41,853 |
| Immigrants | Senegal | 11.3 /100 | #212 | Poor $41,830 |
| Immigrants | Venezuela | 10.2 /100 | #213 | Poor $41,727 |
| Immigrants | Bangladesh | 10.1 /100 | #214 | Poor $41,709 |
| Sudanese | 9.9 /100 | #215 | Tragic $41,695 |
| Tongans | 9.9 /100 | #216 | Tragic $41,693 |
| Guamanians/Chamorros | 9.7 /100 | #217 | Tragic $41,678 |
| Trinidadians and Tobagonians | 9.5 /100 | #218 | Tragic $41,655 |
| Puget Sound Salish | 8.1 /100 | #219 | Tragic $41,495 |
| Immigrants | Barbados | 7.9 /100 | #220 | Tragic $41,478 |
| Immigrants | Trinidad and Tobago | 7.9 /100 | #221 | Tragic $41,476 |
| Immigrants | Iraq | 7.1 /100 | #222 | Tragic $41,365 |
| Immigrants | Cameroon | 6.8 /100 | #223 | Tragic $41,334 |
| Immigrants | St. Vincent and the Grenadines | 6.4 /100 | #224 | Tragic $41,270 |
| West Indians | 6.0 /100 | #225 | Tragic $41,217 |
Demographics Similar to Immigrants from Italy by Per Capita Income
In terms of per capita income, the demographic groups most similar to Immigrants from Italy are Immigrants from Kazakhstan ($48,747, a difference of 0.19%), Immigrants from England ($48,844, a difference of 0.39%), Romanian ($48,445, a difference of 0.43%), Egyptian ($48,358, a difference of 0.61%), and Immigrants from Bolivia ($48,970, a difference of 0.65%).
| Demographics | Rating | Rank | Per Capita Income |
| Greeks | 99.8 /100 | #71 | Exceptional $49,309 |
| Immigrants | Hungary | 99.8 /100 | #72 | Exceptional $49,303 |
| Immigrants | North America | 99.8 /100 | #73 | Exceptional $49,302 |
| Mongolians | 99.8 /100 | #74 | Exceptional $49,173 |
| Immigrants | Bolivia | 99.7 /100 | #75 | Exceptional $48,970 |
| Immigrants | England | 99.7 /100 | #76 | Exceptional $48,844 |
| Immigrants | Kazakhstan | 99.7 /100 | #77 | Exceptional $48,747 |
| Immigrants | Italy | 99.6 /100 | #78 | Exceptional $48,654 |
| Romanians | 99.5 /100 | #79 | Exceptional $48,445 |
| Egyptians | 99.5 /100 | #80 | Exceptional $48,358 |
| Armenians | 99.4 /100 | #81 | Exceptional $48,287 |
| Immigrants | Indonesia | 99.4 /100 | #82 | Exceptional $48,195 |
| Immigrants | Brazil | 99.4 /100 | #83 | Exceptional $48,164 |
| Immigrants | Ukraine | 99.3 /100 | #84 | Exceptional $48,134 |
| Austrians | 99.3 /100 | #85 | Exceptional $48,116 |