Immigrants from Korea vs Puget Sound Salish Wage/Income Gap
COMPARE
Immigrants from Korea
Puget Sound Salish
Wage/Income Gap
Wage/Income Gap Comparison
Immigrants from Korea
Puget Sound Salish
27.8%
WAGE/INCOME GAP
0.8/ 100
METRIC RATING
272nd/ 347
METRIC RANK
25.3%
WAGE/INCOME GAP
73.0/ 100
METRIC RATING
159th/ 347
METRIC RANK
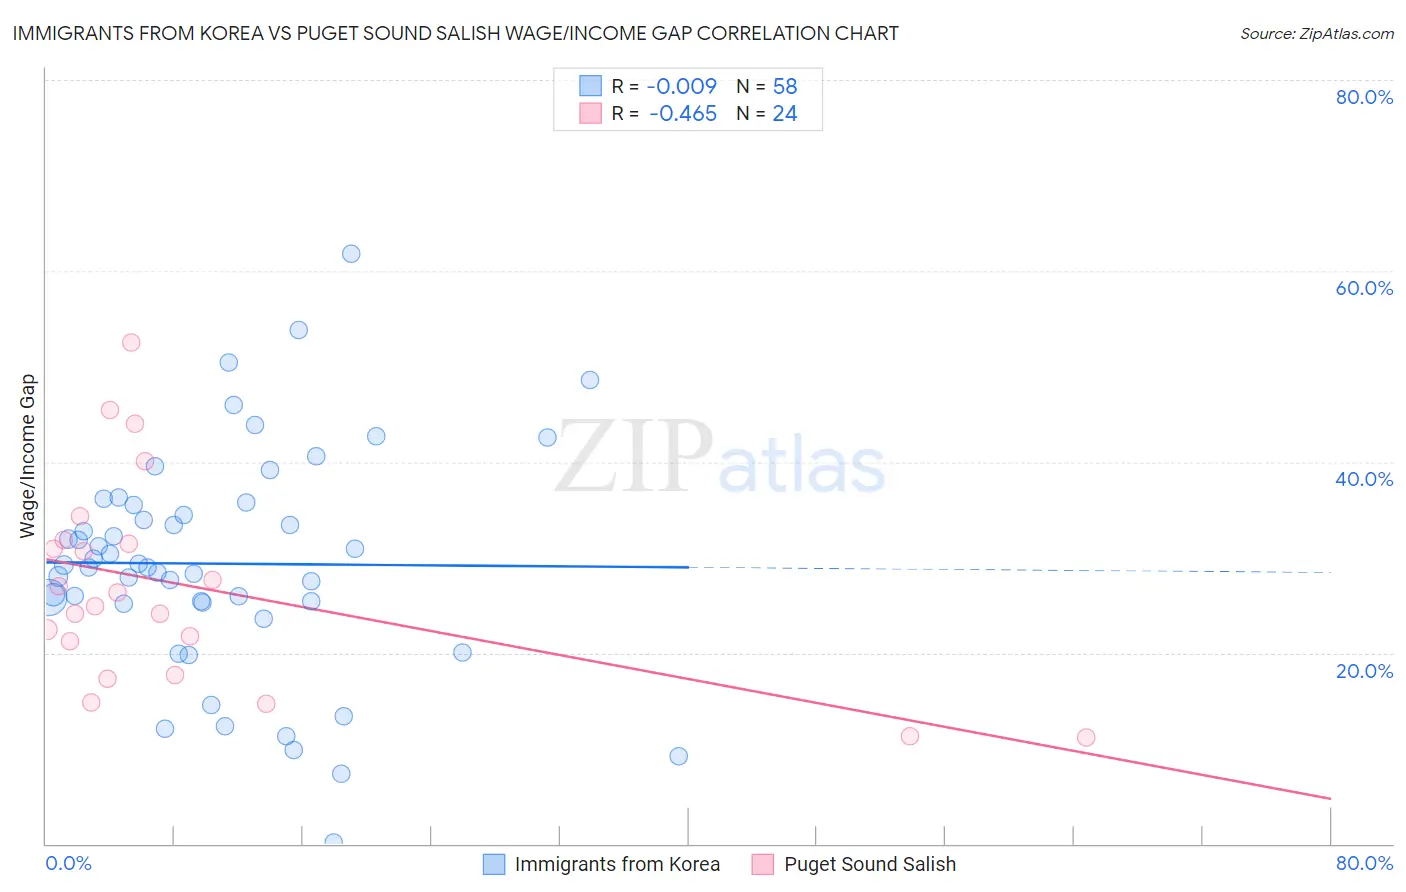
Immigrants from Korea vs Puget Sound Salish Wage/Income Gap Correlation Chart
The statistical analysis conducted on geographies consisting of 416,007,882 people shows no correlation between the proportion of Immigrants from Korea and wage/income gap percentage in the United States with a correlation coefficient (R) of -0.009 and weighted average of 27.8%. Similarly, the statistical analysis conducted on geographies consisting of 46,141,499 people shows a moderate negative correlation between the proportion of Puget Sound Salish and wage/income gap percentage in the United States with a correlation coefficient (R) of -0.465 and weighted average of 25.3%, a difference of 9.7%.
Wage/Income Gap Correlation Summary
| Measurement | Immigrants from Korea | Puget Sound Salish |
| Minimum | 0.13% | 11.2% |
| Maximum | 61.8% | 52.5% |
| Range | 61.7% | 41.3% |
| Mean | 29.3% | 27.0% |
| Median | 29.1% | 25.6% |
| Interquartile 25% (IQ1) | 25.3% | 19.5% |
| Interquartile 75% (IQ3) | 35.5% | 31.7% |
| Interquartile Range (IQR) | 10.2% | 12.2% |
| Standard Deviation (Sample) | 11.7% | 10.7% |
| Standard Deviation (Population) | 11.6% | 10.5% |
Similar Demographics by Wage/Income Gap
Demographics Similar to Immigrants from Korea by Wage/Income Gap
In terms of wage/income gap, the demographic groups most similar to Immigrants from Korea are Ute (27.8%, a difference of 0.070%), Bulgarian (27.8%, a difference of 0.11%), Immigrants from Western Europe (27.8%, a difference of 0.15%), American (27.8%, a difference of 0.15%), and Immigrants from Japan (27.9%, a difference of 0.23%).
| Demographics | Rating | Rank | Wage/Income Gap |
| Serbians | 1.0 /100 | #265 | Tragic 27.7% |
| Hmong | 1.0 /100 | #266 | Tragic 27.7% |
| Turks | 1.0 /100 | #267 | Tragic 27.7% |
| New Zealanders | 1.0 /100 | #268 | Tragic 27.7% |
| Potawatomi | 0.9 /100 | #269 | Tragic 27.7% |
| Immigrants | Western Europe | 0.9 /100 | #270 | Tragic 27.8% |
| Ute | 0.8 /100 | #271 | Tragic 27.8% |
| Immigrants | Korea | 0.8 /100 | #272 | Tragic 27.8% |
| Bulgarians | 0.7 /100 | #273 | Tragic 27.8% |
| Americans | 0.7 /100 | #274 | Tragic 27.8% |
| Immigrants | Japan | 0.7 /100 | #275 | Tragic 27.9% |
| Lebanese | 0.7 /100 | #276 | Tragic 27.9% |
| Latvians | 0.7 /100 | #277 | Tragic 27.9% |
| Immigrants | England | 0.6 /100 | #278 | Tragic 27.9% |
| Romanians | 0.5 /100 | #279 | Tragic 28.0% |
Demographics Similar to Puget Sound Salish by Wage/Income Gap
In terms of wage/income gap, the demographic groups most similar to Puget Sound Salish are French American Indian (25.4%, a difference of 0.040%), Immigrants from Zimbabwe (25.3%, a difference of 0.060%), Costa Rican (25.3%, a difference of 0.24%), Albanian (25.4%, a difference of 0.29%), and Immigrants from Mexico (25.3%, a difference of 0.30%).
| Demographics | Rating | Rank | Wage/Income Gap |
| Uruguayans | 81.3 /100 | #152 | Excellent 25.2% |
| Blackfeet | 78.1 /100 | #153 | Good 25.2% |
| Immigrants | Northern Africa | 78.1 /100 | #154 | Good 25.2% |
| Immigrants | Vietnam | 77.7 /100 | #155 | Good 25.2% |
| Immigrants | Mexico | 76.4 /100 | #156 | Good 25.3% |
| Costa Ricans | 75.8 /100 | #157 | Good 25.3% |
| Immigrants | Zimbabwe | 73.7 /100 | #158 | Good 25.3% |
| Puget Sound Salish | 73.0 /100 | #159 | Good 25.3% |
| French American Indians | 72.5 /100 | #160 | Good 25.4% |
| Albanians | 69.4 /100 | #161 | Good 25.4% |
| Shoshone | 69.0 /100 | #162 | Good 25.4% |
| Native Hawaiians | 69.0 /100 | #163 | Good 25.4% |
| Koreans | 68.6 /100 | #164 | Good 25.4% |
| Immigrants | Hong Kong | 64.0 /100 | #165 | Good 25.5% |
| Immigrants | Ukraine | 63.8 /100 | #166 | Good 25.5% |