Fijian vs Puget Sound Salish Wage/Income Gap
COMPARE
Fijian
Puget Sound Salish
Wage/Income Gap
Wage/Income Gap Comparison
Fijians
Puget Sound Salish
22.9%
WAGE/INCOME GAP
99.9/ 100
METRIC RATING
75th/ 347
METRIC RANK
25.3%
WAGE/INCOME GAP
73.0/ 100
METRIC RATING
159th/ 347
METRIC RANK
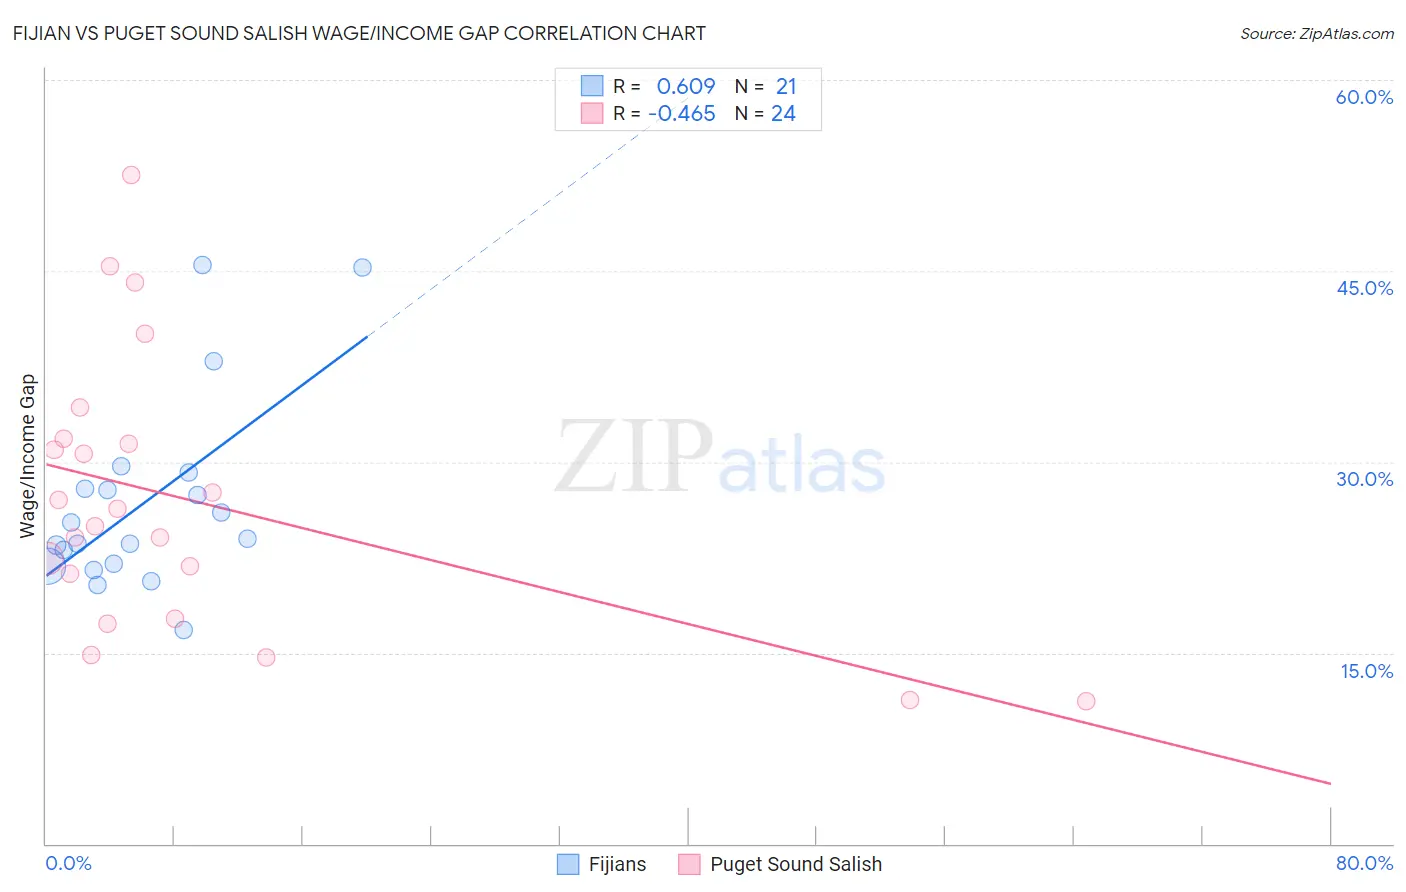
Fijian vs Puget Sound Salish Wage/Income Gap Correlation Chart
The statistical analysis conducted on geographies consisting of 55,941,017 people shows a significant positive correlation between the proportion of Fijians and wage/income gap percentage in the United States with a correlation coefficient (R) of 0.609 and weighted average of 22.9%. Similarly, the statistical analysis conducted on geographies consisting of 46,141,499 people shows a moderate negative correlation between the proportion of Puget Sound Salish and wage/income gap percentage in the United States with a correlation coefficient (R) of -0.465 and weighted average of 25.3%, a difference of 10.7%.
Wage/Income Gap Correlation Summary
| Measurement | Fijian | Puget Sound Salish |
| Minimum | 16.8% | 11.2% |
| Maximum | 45.5% | 52.5% |
| Range | 28.7% | 41.3% |
| Mean | 26.8% | 27.0% |
| Median | 23.9% | 25.6% |
| Interquartile 25% (IQ1) | 21.9% | 19.5% |
| Interquartile 75% (IQ3) | 28.5% | 31.7% |
| Interquartile Range (IQR) | 6.6% | 12.2% |
| Standard Deviation (Sample) | 7.6% | 10.7% |
| Standard Deviation (Population) | 7.4% | 10.5% |
Similar Demographics by Wage/Income Gap
Demographics Similar to Fijians by Wage/Income Gap
In terms of wage/income gap, the demographic groups most similar to Fijians are Ecuadorian (22.9%, a difference of 0.010%), African (22.9%, a difference of 0.15%), Nigerian (23.0%, a difference of 0.25%), Immigrants from Burma/Myanmar (22.8%, a difference of 0.28%), and Immigrants from Nicaragua (23.0%, a difference of 0.34%).
| Demographics | Rating | Rank | Wage/Income Gap |
| Immigrants | Nigeria | 99.9 /100 | #68 | Exceptional 22.7% |
| Indonesians | 99.9 /100 | #69 | Exceptional 22.7% |
| Immigrants | Uzbekistan | 99.9 /100 | #70 | Exceptional 22.7% |
| Immigrants | El Salvador | 99.9 /100 | #71 | Exceptional 22.8% |
| Sub-Saharan Africans | 99.9 /100 | #72 | Exceptional 22.8% |
| Immigrants | Eastern Africa | 99.9 /100 | #73 | Exceptional 22.8% |
| Immigrants | Burma/Myanmar | 99.9 /100 | #74 | Exceptional 22.8% |
| Fijians | 99.9 /100 | #75 | Exceptional 22.9% |
| Ecuadorians | 99.9 /100 | #76 | Exceptional 22.9% |
| Africans | 99.9 /100 | #77 | Exceptional 22.9% |
| Nigerians | 99.9 /100 | #78 | Exceptional 23.0% |
| Immigrants | Nicaragua | 99.9 /100 | #79 | Exceptional 23.0% |
| Salvadorans | 99.9 /100 | #80 | Exceptional 23.0% |
| Bermudans | 99.8 /100 | #81 | Exceptional 23.1% |
| Central Americans | 99.8 /100 | #82 | Exceptional 23.1% |
Demographics Similar to Puget Sound Salish by Wage/Income Gap
In terms of wage/income gap, the demographic groups most similar to Puget Sound Salish are French American Indian (25.4%, a difference of 0.040%), Immigrants from Zimbabwe (25.3%, a difference of 0.060%), Costa Rican (25.3%, a difference of 0.24%), Albanian (25.4%, a difference of 0.29%), and Immigrants from Mexico (25.3%, a difference of 0.30%).
| Demographics | Rating | Rank | Wage/Income Gap |
| Uruguayans | 81.3 /100 | #152 | Excellent 25.2% |
| Blackfeet | 78.1 /100 | #153 | Good 25.2% |
| Immigrants | Northern Africa | 78.1 /100 | #154 | Good 25.2% |
| Immigrants | Vietnam | 77.7 /100 | #155 | Good 25.2% |
| Immigrants | Mexico | 76.4 /100 | #156 | Good 25.3% |
| Costa Ricans | 75.8 /100 | #157 | Good 25.3% |
| Immigrants | Zimbabwe | 73.7 /100 | #158 | Good 25.3% |
| Puget Sound Salish | 73.0 /100 | #159 | Good 25.3% |
| French American Indians | 72.5 /100 | #160 | Good 25.4% |
| Albanians | 69.4 /100 | #161 | Good 25.4% |
| Shoshone | 69.0 /100 | #162 | Good 25.4% |
| Native Hawaiians | 69.0 /100 | #163 | Good 25.4% |
| Koreans | 68.6 /100 | #164 | Good 25.4% |
| Immigrants | Hong Kong | 64.0 /100 | #165 | Good 25.5% |
| Immigrants | Ukraine | 63.8 /100 | #166 | Good 25.5% |