Immigrants from Korea vs Puget Sound Salish Professional Degree
COMPARE
Immigrants from Korea
Puget Sound Salish
Professional Degree
Professional Degree Comparison
Immigrants from Korea
Puget Sound Salish
6.1%
PROFESSIONAL DEGREE
100.0/ 100
METRIC RATING
35th/ 347
METRIC RANK
3.1%
PROFESSIONAL DEGREE
0.0/ 100
METRIC RATING
333rd/ 347
METRIC RANK
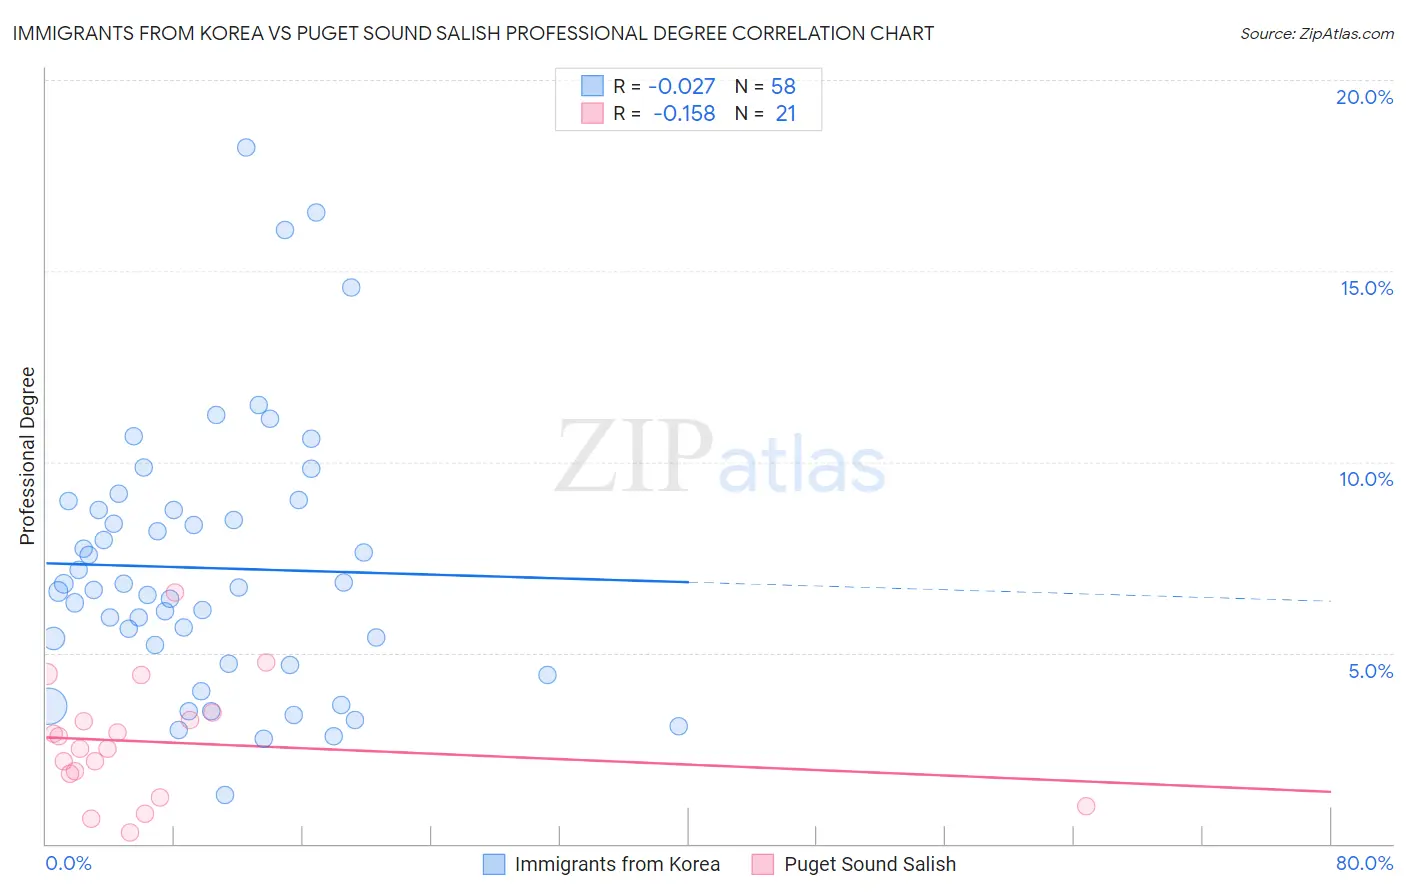
Immigrants from Korea vs Puget Sound Salish Professional Degree Correlation Chart
The statistical analysis conducted on geographies consisting of 415,494,018 people shows no correlation between the proportion of Immigrants from Korea and percentage of population with at least professional degree education in the United States with a correlation coefficient (R) of -0.027 and weighted average of 6.1%. Similarly, the statistical analysis conducted on geographies consisting of 46,093,850 people shows a poor negative correlation between the proportion of Puget Sound Salish and percentage of population with at least professional degree education in the United States with a correlation coefficient (R) of -0.158 and weighted average of 3.1%, a difference of 98.0%.
Professional Degree Correlation Summary
| Measurement | Immigrants from Korea | Puget Sound Salish |
| Minimum | 1.3% | 0.31% |
| Maximum | 18.2% | 6.6% |
| Range | 17.0% | 6.3% |
| Mean | 7.2% | 2.7% |
| Median | 6.7% | 2.5% |
| Interquartile 25% (IQ1) | 4.7% | 1.5% |
| Interquartile 75% (IQ3) | 8.7% | 3.3% |
| Interquartile Range (IQR) | 4.0% | 1.8% |
| Standard Deviation (Sample) | 3.5% | 1.5% |
| Standard Deviation (Population) | 3.5% | 1.5% |
Similar Demographics by Professional Degree
Demographics Similar to Immigrants from Korea by Professional Degree
In terms of professional degree, the demographic groups most similar to Immigrants from Korea are Mongolian (6.1%, a difference of 0.66%), Burmese (6.1%, a difference of 0.80%), Thai (6.1%, a difference of 0.83%), Immigrants from Russia (6.0%, a difference of 0.90%), and Immigrants from India (6.2%, a difference of 1.1%).
| Demographics | Rating | Rank | Professional Degree |
| Turks | 100.0 /100 | #28 | Exceptional 6.2% |
| Immigrants | Sri Lanka | 100.0 /100 | #29 | Exceptional 6.2% |
| Immigrants | Turkey | 100.0 /100 | #30 | Exceptional 6.2% |
| Immigrants | India | 100.0 /100 | #31 | Exceptional 6.2% |
| Thais | 100.0 /100 | #32 | Exceptional 6.1% |
| Burmese | 100.0 /100 | #33 | Exceptional 6.1% |
| Mongolians | 100.0 /100 | #34 | Exceptional 6.1% |
| Immigrants | Korea | 100.0 /100 | #35 | Exceptional 6.1% |
| Immigrants | Russia | 100.0 /100 | #36 | Exceptional 6.0% |
| Immigrants | Austria | 100.0 /100 | #37 | Exceptional 6.0% |
| Immigrants | Norway | 100.0 /100 | #38 | Exceptional 6.0% |
| Immigrants | South Africa | 100.0 /100 | #39 | Exceptional 6.0% |
| Cambodians | 100.0 /100 | #40 | Exceptional 6.0% |
| New Zealanders | 100.0 /100 | #41 | Exceptional 6.0% |
| Estonians | 100.0 /100 | #42 | Exceptional 6.0% |
Demographics Similar to Puget Sound Salish by Professional Degree
In terms of professional degree, the demographic groups most similar to Puget Sound Salish are Yakama (3.1%, a difference of 0.030%), Kiowa (3.1%, a difference of 0.14%), Immigrants from Cabo Verde (3.1%, a difference of 0.26%), Bangladeshi (3.1%, a difference of 0.34%), and Creek (3.1%, a difference of 0.55%).
| Demographics | Rating | Rank | Professional Degree |
| Menominee | 0.0 /100 | #326 | Tragic 3.1% |
| Dutch West Indians | 0.0 /100 | #327 | Tragic 3.1% |
| Creek | 0.0 /100 | #328 | Tragic 3.1% |
| Bangladeshis | 0.0 /100 | #329 | Tragic 3.1% |
| Immigrants | Cabo Verde | 0.0 /100 | #330 | Tragic 3.1% |
| Kiowa | 0.0 /100 | #331 | Tragic 3.1% |
| Yakama | 0.0 /100 | #332 | Tragic 3.1% |
| Puget Sound Salish | 0.0 /100 | #333 | Tragic 3.1% |
| Pennsylvania Germans | 0.0 /100 | #334 | Tragic 3.0% |
| Natives/Alaskans | 0.0 /100 | #335 | Tragic 3.0% |
| Fijians | 0.0 /100 | #336 | Tragic 2.9% |
| Arapaho | 0.0 /100 | #337 | Tragic 2.9% |
| Navajo | 0.0 /100 | #338 | Tragic 2.9% |
| Immigrants | Central America | 0.0 /100 | #339 | Tragic 2.9% |
| Yup'ik | 0.0 /100 | #340 | Tragic 2.9% |