Immigrants from Korea vs Immigrants from Northern Europe Wage/Income Gap
COMPARE
Immigrants from Korea
Immigrants from Northern Europe
Wage/Income Gap
Wage/Income Gap Comparison
Immigrants from Korea
Immigrants from Northern Europe
27.8%
WAGE/INCOME GAP
0.8/ 100
METRIC RATING
272nd/ 347
METRIC RANK
28.5%
WAGE/INCOME GAP
0.2/ 100
METRIC RATING
300th/ 347
METRIC RANK
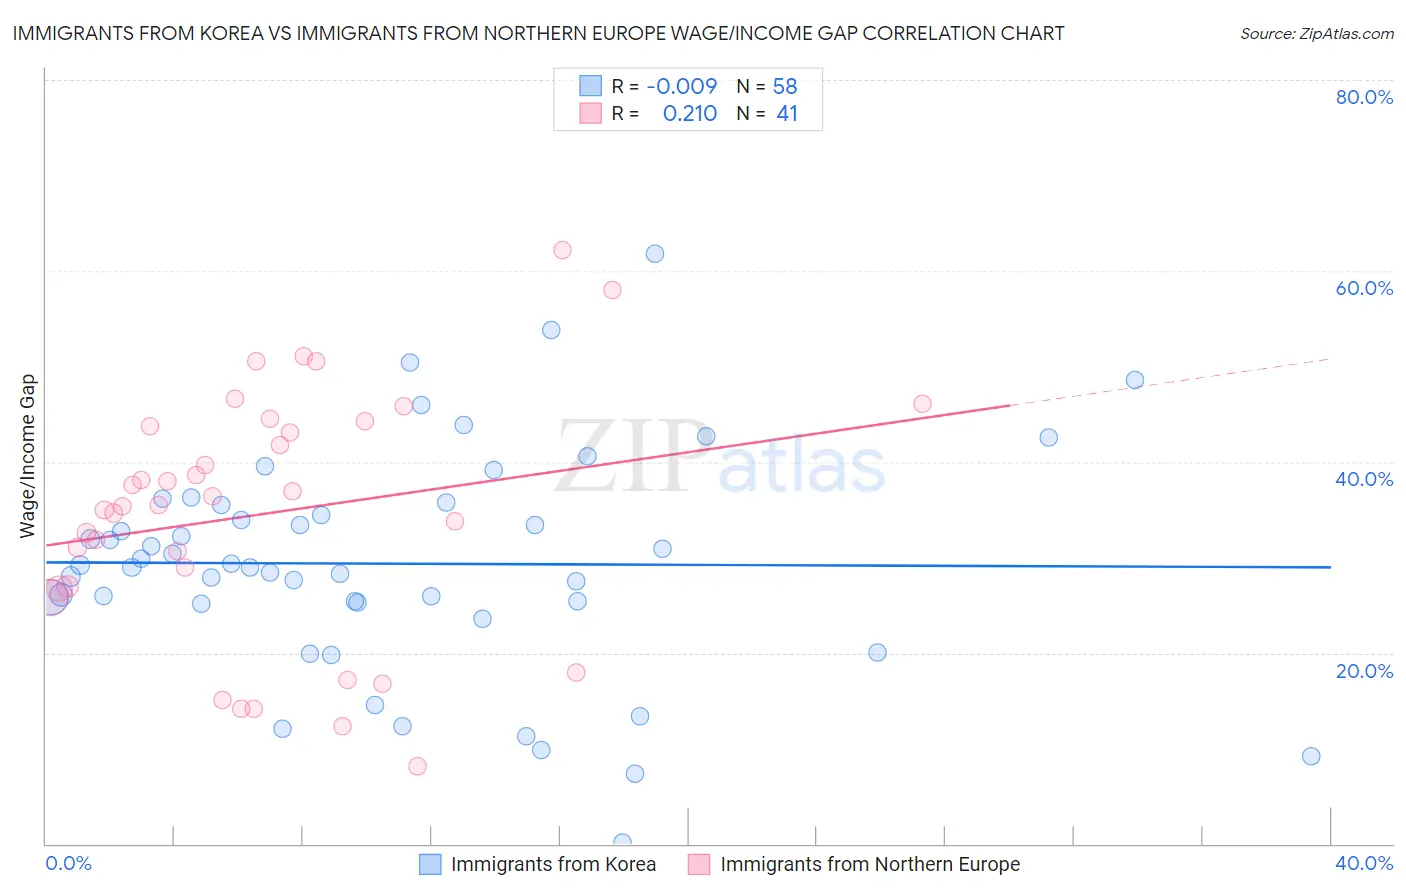
Immigrants from Korea vs Immigrants from Northern Europe Wage/Income Gap Correlation Chart
The statistical analysis conducted on geographies consisting of 416,007,882 people shows no correlation between the proportion of Immigrants from Korea and wage/income gap percentage in the United States with a correlation coefficient (R) of -0.009 and weighted average of 27.8%. Similarly, the statistical analysis conducted on geographies consisting of 476,427,799 people shows a weak positive correlation between the proportion of Immigrants from Northern Europe and wage/income gap percentage in the United States with a correlation coefficient (R) of 0.210 and weighted average of 28.5%, a difference of 2.4%.
Wage/Income Gap Correlation Summary
| Measurement | Immigrants from Korea | Immigrants from Northern Europe |
| Minimum | 0.13% | 8.1% |
| Maximum | 61.8% | 62.1% |
| Range | 61.7% | 54.0% |
| Mean | 29.3% | 34.6% |
| Median | 29.1% | 35.4% |
| Interquartile 25% (IQ1) | 25.3% | 26.8% |
| Interquartile 75% (IQ3) | 35.5% | 44.0% |
| Interquartile Range (IQR) | 10.2% | 17.2% |
| Standard Deviation (Sample) | 11.7% | 12.8% |
| Standard Deviation (Population) | 11.6% | 12.6% |
Similar Demographics by Wage/Income Gap
Demographics Similar to Immigrants from Korea by Wage/Income Gap
In terms of wage/income gap, the demographic groups most similar to Immigrants from Korea are Ute (27.8%, a difference of 0.070%), Bulgarian (27.8%, a difference of 0.11%), Immigrants from Western Europe (27.8%, a difference of 0.15%), American (27.8%, a difference of 0.15%), and Immigrants from Japan (27.9%, a difference of 0.23%).
| Demographics | Rating | Rank | Wage/Income Gap |
| Serbians | 1.0 /100 | #265 | Tragic 27.7% |
| Hmong | 1.0 /100 | #266 | Tragic 27.7% |
| Turks | 1.0 /100 | #267 | Tragic 27.7% |
| New Zealanders | 1.0 /100 | #268 | Tragic 27.7% |
| Potawatomi | 0.9 /100 | #269 | Tragic 27.7% |
| Immigrants | Western Europe | 0.9 /100 | #270 | Tragic 27.8% |
| Ute | 0.8 /100 | #271 | Tragic 27.8% |
| Immigrants | Korea | 0.8 /100 | #272 | Tragic 27.8% |
| Bulgarians | 0.7 /100 | #273 | Tragic 27.8% |
| Americans | 0.7 /100 | #274 | Tragic 27.8% |
| Immigrants | Japan | 0.7 /100 | #275 | Tragic 27.9% |
| Lebanese | 0.7 /100 | #276 | Tragic 27.9% |
| Latvians | 0.7 /100 | #277 | Tragic 27.9% |
| Immigrants | England | 0.6 /100 | #278 | Tragic 27.9% |
| Romanians | 0.5 /100 | #279 | Tragic 28.0% |
Demographics Similar to Immigrants from Northern Europe by Wage/Income Gap
In terms of wage/income gap, the demographic groups most similar to Immigrants from Northern Europe are Immigrants from Canada (28.5%, a difference of 0.040%), Scotch-Irish (28.5%, a difference of 0.070%), Irish (28.5%, a difference of 0.080%), Immigrants from North Macedonia (28.4%, a difference of 0.12%), and Austrian (28.4%, a difference of 0.16%).
| Demographics | Rating | Rank | Wage/Income Gap |
| Immigrants | Israel | 0.3 /100 | #293 | Tragic 28.2% |
| Greeks | 0.3 /100 | #294 | Tragic 28.2% |
| Slovenes | 0.3 /100 | #295 | Tragic 28.3% |
| Northern Europeans | 0.3 /100 | #296 | Tragic 28.3% |
| Immigrants | North America | 0.2 /100 | #297 | Tragic 28.4% |
| Austrians | 0.2 /100 | #298 | Tragic 28.4% |
| Immigrants | North Macedonia | 0.2 /100 | #299 | Tragic 28.4% |
| Immigrants | Northern Europe | 0.2 /100 | #300 | Tragic 28.5% |
| Immigrants | Canada | 0.2 /100 | #301 | Tragic 28.5% |
| Scotch-Irish | 0.2 /100 | #302 | Tragic 28.5% |
| Irish | 0.2 /100 | #303 | Tragic 28.5% |
| Immigrants | Netherlands | 0.2 /100 | #304 | Tragic 28.5% |
| Immigrants | South Africa | 0.1 /100 | #305 | Tragic 28.5% |
| Whites/Caucasians | 0.1 /100 | #306 | Tragic 28.5% |
| Immigrants | Denmark | 0.1 /100 | #307 | Tragic 28.5% |