Immigrants from Korea vs Immigrants from Nicaragua Wage/Income Gap
COMPARE
Immigrants from Korea
Immigrants from Nicaragua
Wage/Income Gap
Wage/Income Gap Comparison
Immigrants from Korea
Immigrants from Nicaragua
27.8%
WAGE/INCOME GAP
0.8/ 100
METRIC RATING
272nd/ 347
METRIC RANK
23.0%
WAGE/INCOME GAP
99.9/ 100
METRIC RATING
79th/ 347
METRIC RANK
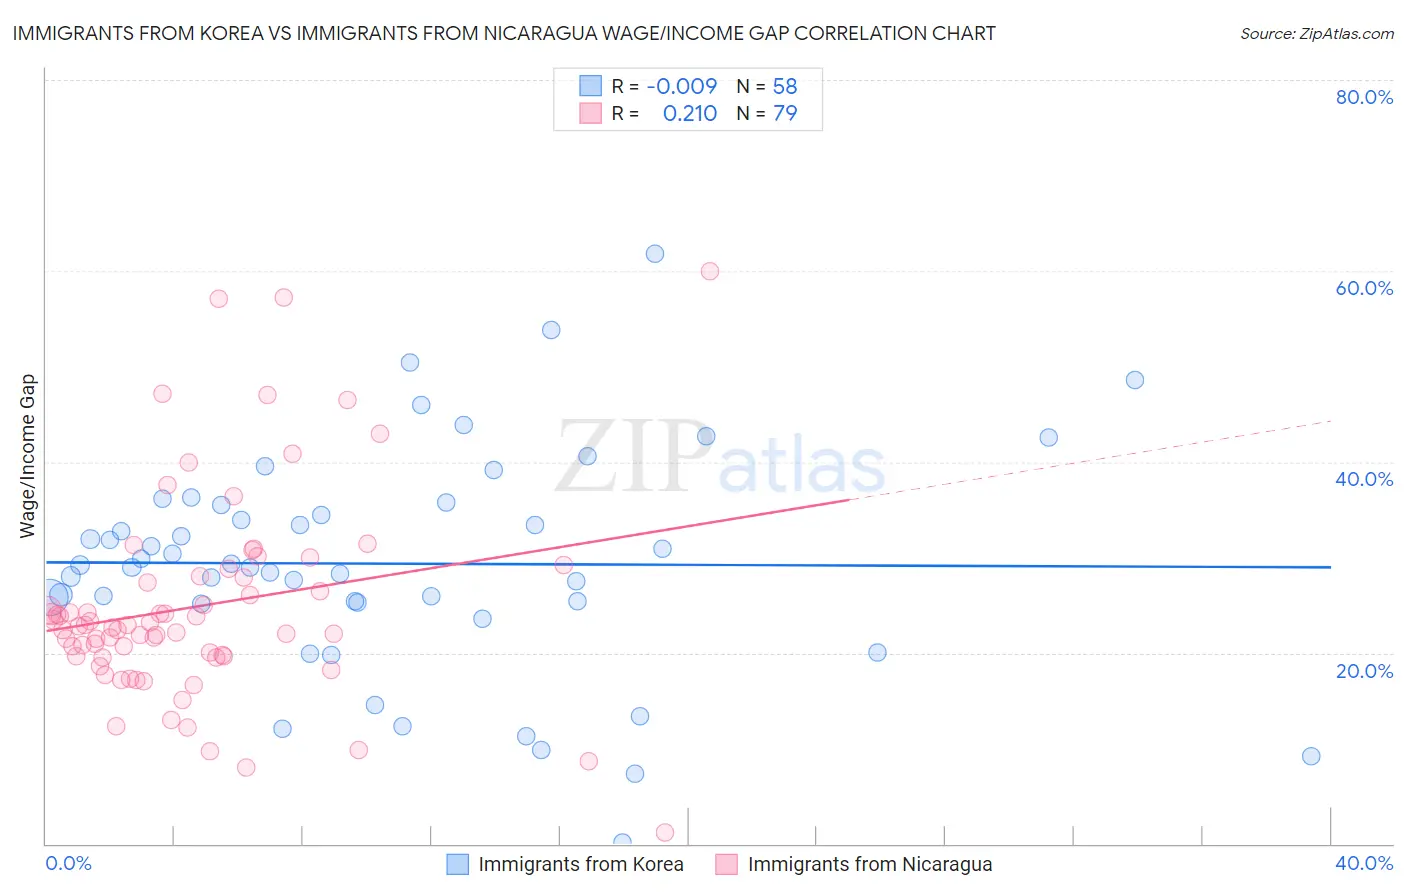
Immigrants from Korea vs Immigrants from Nicaragua Wage/Income Gap Correlation Chart
The statistical analysis conducted on geographies consisting of 416,007,882 people shows no correlation between the proportion of Immigrants from Korea and wage/income gap percentage in the United States with a correlation coefficient (R) of -0.009 and weighted average of 27.8%. Similarly, the statistical analysis conducted on geographies consisting of 236,266,480 people shows a weak positive correlation between the proportion of Immigrants from Nicaragua and wage/income gap percentage in the United States with a correlation coefficient (R) of 0.210 and weighted average of 23.0%, a difference of 20.9%.
Wage/Income Gap Correlation Summary
| Measurement | Immigrants from Korea | Immigrants from Nicaragua |
| Minimum | 0.13% | 1.2% |
| Maximum | 61.8% | 60.0% |
| Range | 61.7% | 58.8% |
| Mean | 29.3% | 24.9% |
| Median | 29.1% | 22.8% |
| Interquartile 25% (IQ1) | 25.3% | 19.6% |
| Interquartile 75% (IQ3) | 35.5% | 28.0% |
| Interquartile Range (IQR) | 10.2% | 8.4% |
| Standard Deviation (Sample) | 11.7% | 10.8% |
| Standard Deviation (Population) | 11.6% | 10.7% |
Similar Demographics by Wage/Income Gap
Demographics Similar to Immigrants from Korea by Wage/Income Gap
In terms of wage/income gap, the demographic groups most similar to Immigrants from Korea are Ute (27.8%, a difference of 0.070%), Bulgarian (27.8%, a difference of 0.11%), Immigrants from Western Europe (27.8%, a difference of 0.15%), American (27.8%, a difference of 0.15%), and Immigrants from Japan (27.9%, a difference of 0.23%).
| Demographics | Rating | Rank | Wage/Income Gap |
| Serbians | 1.0 /100 | #265 | Tragic 27.7% |
| Hmong | 1.0 /100 | #266 | Tragic 27.7% |
| Turks | 1.0 /100 | #267 | Tragic 27.7% |
| New Zealanders | 1.0 /100 | #268 | Tragic 27.7% |
| Potawatomi | 0.9 /100 | #269 | Tragic 27.7% |
| Immigrants | Western Europe | 0.9 /100 | #270 | Tragic 27.8% |
| Ute | 0.8 /100 | #271 | Tragic 27.8% |
| Immigrants | Korea | 0.8 /100 | #272 | Tragic 27.8% |
| Bulgarians | 0.7 /100 | #273 | Tragic 27.8% |
| Americans | 0.7 /100 | #274 | Tragic 27.8% |
| Immigrants | Japan | 0.7 /100 | #275 | Tragic 27.9% |
| Lebanese | 0.7 /100 | #276 | Tragic 27.9% |
| Latvians | 0.7 /100 | #277 | Tragic 27.9% |
| Immigrants | England | 0.6 /100 | #278 | Tragic 27.9% |
| Romanians | 0.5 /100 | #279 | Tragic 28.0% |
Demographics Similar to Immigrants from Nicaragua by Wage/Income Gap
In terms of wage/income gap, the demographic groups most similar to Immigrants from Nicaragua are Salvadoran (23.0%, a difference of 0.070%), Nigerian (23.0%, a difference of 0.090%), African (22.9%, a difference of 0.19%), Ecuadorian (22.9%, a difference of 0.33%), and Fijian (22.9%, a difference of 0.34%).
| Demographics | Rating | Rank | Wage/Income Gap |
| Sub-Saharan Africans | 99.9 /100 | #72 | Exceptional 22.8% |
| Immigrants | Eastern Africa | 99.9 /100 | #73 | Exceptional 22.8% |
| Immigrants | Burma/Myanmar | 99.9 /100 | #74 | Exceptional 22.8% |
| Fijians | 99.9 /100 | #75 | Exceptional 22.9% |
| Ecuadorians | 99.9 /100 | #76 | Exceptional 22.9% |
| Africans | 99.9 /100 | #77 | Exceptional 22.9% |
| Nigerians | 99.9 /100 | #78 | Exceptional 23.0% |
| Immigrants | Nicaragua | 99.9 /100 | #79 | Exceptional 23.0% |
| Salvadorans | 99.9 /100 | #80 | Exceptional 23.0% |
| Bermudans | 99.8 /100 | #81 | Exceptional 23.1% |
| Central Americans | 99.8 /100 | #82 | Exceptional 23.1% |
| Immigrants | Africa | 99.8 /100 | #83 | Exceptional 23.2% |
| Cubans | 99.7 /100 | #84 | Exceptional 23.3% |
| Immigrants | Cambodia | 99.7 /100 | #85 | Exceptional 23.3% |
| Cheyenne | 99.7 /100 | #86 | Exceptional 23.3% |