Arapaho vs Puget Sound Salish Wage/Income Gap
COMPARE
Arapaho
Puget Sound Salish
Wage/Income Gap
Wage/Income Gap Comparison
Arapaho
Puget Sound Salish
23.5%
WAGE/INCOME GAP
99.6/ 100
METRIC RATING
91st/ 347
METRIC RANK
25.3%
WAGE/INCOME GAP
73.0/ 100
METRIC RATING
159th/ 347
METRIC RANK
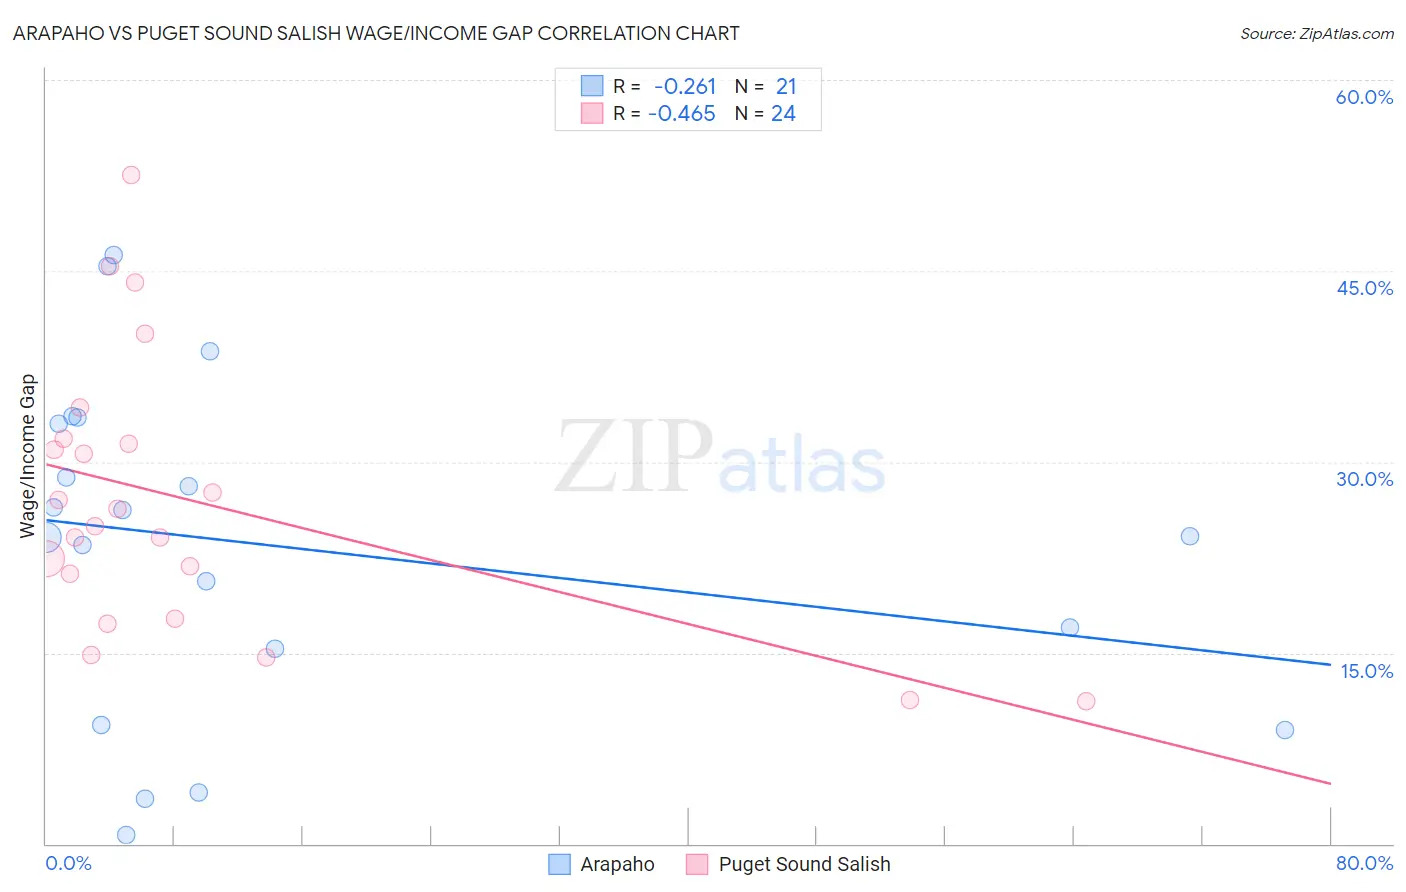
Arapaho vs Puget Sound Salish Wage/Income Gap Correlation Chart
The statistical analysis conducted on geographies consisting of 29,769,339 people shows a weak negative correlation between the proportion of Arapaho and wage/income gap percentage in the United States with a correlation coefficient (R) of -0.261 and weighted average of 23.5%. Similarly, the statistical analysis conducted on geographies consisting of 46,141,499 people shows a moderate negative correlation between the proportion of Puget Sound Salish and wage/income gap percentage in the United States with a correlation coefficient (R) of -0.465 and weighted average of 25.3%, a difference of 8.0%.
Wage/Income Gap Correlation Summary
| Measurement | Arapaho | Puget Sound Salish |
| Minimum | 0.71% | 11.2% |
| Maximum | 46.3% | 52.5% |
| Range | 45.6% | 41.3% |
| Mean | 23.4% | 27.0% |
| Median | 24.1% | 25.6% |
| Interquartile 25% (IQ1) | 12.3% | 19.5% |
| Interquartile 75% (IQ3) | 33.3% | 31.7% |
| Interquartile Range (IQR) | 20.9% | 12.2% |
| Standard Deviation (Sample) | 13.1% | 10.7% |
| Standard Deviation (Population) | 12.8% | 10.5% |
Similar Demographics by Wage/Income Gap
Demographics Similar to Arapaho by Wage/Income Gap
In terms of wage/income gap, the demographic groups most similar to Arapaho are Nicaraguan (23.4%, a difference of 0.14%), Marshallese (23.4%, a difference of 0.15%), Immigrants from Honduras (23.5%, a difference of 0.15%), Immigrants from Panama (23.4%, a difference of 0.24%), and Immigrants from Cabo Verde (23.6%, a difference of 0.39%).
| Demographics | Rating | Rank | Wage/Income Gap |
| Cubans | 99.7 /100 | #84 | Exceptional 23.3% |
| Immigrants | Cambodia | 99.7 /100 | #85 | Exceptional 23.3% |
| Cheyenne | 99.7 /100 | #86 | Exceptional 23.3% |
| Yuman | 99.7 /100 | #87 | Exceptional 23.3% |
| Immigrants | Panama | 99.6 /100 | #88 | Exceptional 23.4% |
| Marshallese | 99.6 /100 | #89 | Exceptional 23.4% |
| Nicaraguans | 99.6 /100 | #90 | Exceptional 23.4% |
| Arapaho | 99.6 /100 | #91 | Exceptional 23.5% |
| Immigrants | Honduras | 99.5 /100 | #92 | Exceptional 23.5% |
| Immigrants | Cabo Verde | 99.5 /100 | #93 | Exceptional 23.6% |
| Hondurans | 99.5 /100 | #94 | Exceptional 23.6% |
| Cape Verdeans | 99.4 /100 | #95 | Exceptional 23.6% |
| Kiowa | 99.4 /100 | #96 | Exceptional 23.6% |
| Immigrants | Sudan | 99.4 /100 | #97 | Exceptional 23.6% |
| Immigrants | Latin America | 99.2 /100 | #98 | Exceptional 23.7% |
Demographics Similar to Puget Sound Salish by Wage/Income Gap
In terms of wage/income gap, the demographic groups most similar to Puget Sound Salish are French American Indian (25.4%, a difference of 0.040%), Immigrants from Zimbabwe (25.3%, a difference of 0.060%), Costa Rican (25.3%, a difference of 0.24%), Albanian (25.4%, a difference of 0.29%), and Immigrants from Mexico (25.3%, a difference of 0.30%).
| Demographics | Rating | Rank | Wage/Income Gap |
| Uruguayans | 81.3 /100 | #152 | Excellent 25.2% |
| Blackfeet | 78.1 /100 | #153 | Good 25.2% |
| Immigrants | Northern Africa | 78.1 /100 | #154 | Good 25.2% |
| Immigrants | Vietnam | 77.7 /100 | #155 | Good 25.2% |
| Immigrants | Mexico | 76.4 /100 | #156 | Good 25.3% |
| Costa Ricans | 75.8 /100 | #157 | Good 25.3% |
| Immigrants | Zimbabwe | 73.7 /100 | #158 | Good 25.3% |
| Puget Sound Salish | 73.0 /100 | #159 | Good 25.3% |
| French American Indians | 72.5 /100 | #160 | Good 25.4% |
| Albanians | 69.4 /100 | #161 | Good 25.4% |
| Shoshone | 69.0 /100 | #162 | Good 25.4% |
| Native Hawaiians | 69.0 /100 | #163 | Good 25.4% |
| Koreans | 68.6 /100 | #164 | Good 25.4% |
| Immigrants | Hong Kong | 64.0 /100 | #165 | Good 25.5% |
| Immigrants | Ukraine | 63.8 /100 | #166 | Good 25.5% |