Immigrants from Korea vs Immigrants from Colombia Wage/Income Gap
COMPARE
Immigrants from Korea
Immigrants from Colombia
Wage/Income Gap
Wage/Income Gap Comparison
Immigrants from Korea
Immigrants from Colombia
27.8%
WAGE/INCOME GAP
0.8/ 100
METRIC RATING
272nd/ 347
METRIC RANK
24.3%
WAGE/INCOME GAP
97.0/ 100
METRIC RATING
112th/ 347
METRIC RANK
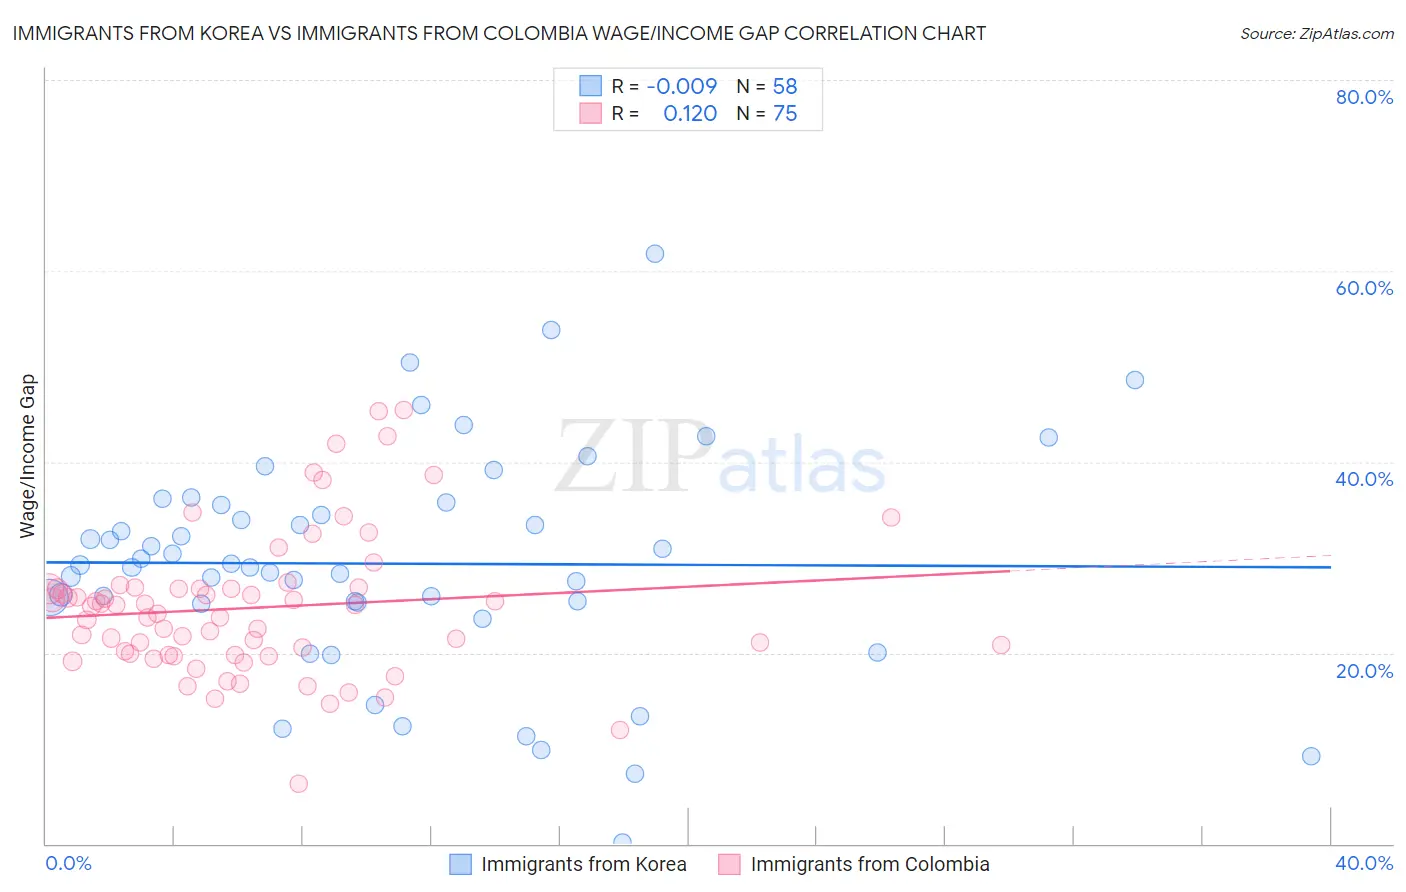
Immigrants from Korea vs Immigrants from Colombia Wage/Income Gap Correlation Chart
The statistical analysis conducted on geographies consisting of 416,007,882 people shows no correlation between the proportion of Immigrants from Korea and wage/income gap percentage in the United States with a correlation coefficient (R) of -0.009 and weighted average of 27.8%. Similarly, the statistical analysis conducted on geographies consisting of 378,481,077 people shows a poor positive correlation between the proportion of Immigrants from Colombia and wage/income gap percentage in the United States with a correlation coefficient (R) of 0.120 and weighted average of 24.3%, a difference of 14.3%.
Wage/Income Gap Correlation Summary
| Measurement | Immigrants from Korea | Immigrants from Colombia |
| Minimum | 0.13% | 6.3% |
| Maximum | 61.8% | 45.5% |
| Range | 61.7% | 39.1% |
| Mean | 29.3% | 24.7% |
| Median | 29.1% | 24.8% |
| Interquartile 25% (IQ1) | 25.3% | 19.7% |
| Interquartile 75% (IQ3) | 35.5% | 26.7% |
| Interquartile Range (IQR) | 10.2% | 7.0% |
| Standard Deviation (Sample) | 11.7% | 7.5% |
| Standard Deviation (Population) | 11.6% | 7.4% |
Similar Demographics by Wage/Income Gap
Demographics Similar to Immigrants from Korea by Wage/Income Gap
In terms of wage/income gap, the demographic groups most similar to Immigrants from Korea are Ute (27.8%, a difference of 0.070%), Bulgarian (27.8%, a difference of 0.11%), Immigrants from Western Europe (27.8%, a difference of 0.15%), American (27.8%, a difference of 0.15%), and Immigrants from Japan (27.9%, a difference of 0.23%).
| Demographics | Rating | Rank | Wage/Income Gap |
| Serbians | 1.0 /100 | #265 | Tragic 27.7% |
| Hmong | 1.0 /100 | #266 | Tragic 27.7% |
| Turks | 1.0 /100 | #267 | Tragic 27.7% |
| New Zealanders | 1.0 /100 | #268 | Tragic 27.7% |
| Potawatomi | 0.9 /100 | #269 | Tragic 27.7% |
| Immigrants | Western Europe | 0.9 /100 | #270 | Tragic 27.8% |
| Ute | 0.8 /100 | #271 | Tragic 27.8% |
| Immigrants | Korea | 0.8 /100 | #272 | Tragic 27.8% |
| Bulgarians | 0.7 /100 | #273 | Tragic 27.8% |
| Americans | 0.7 /100 | #274 | Tragic 27.8% |
| Immigrants | Japan | 0.7 /100 | #275 | Tragic 27.9% |
| Lebanese | 0.7 /100 | #276 | Tragic 27.9% |
| Latvians | 0.7 /100 | #277 | Tragic 27.9% |
| Immigrants | England | 0.6 /100 | #278 | Tragic 27.9% |
| Romanians | 0.5 /100 | #279 | Tragic 28.0% |
Demographics Similar to Immigrants from Colombia by Wage/Income Gap
In terms of wage/income gap, the demographic groups most similar to Immigrants from Colombia are Sioux (24.3%, a difference of 0.050%), Panamanian (24.4%, a difference of 0.25%), Immigrants from Kenya (24.4%, a difference of 0.31%), Soviet Union (24.2%, a difference of 0.40%), and Alaska Native (24.4%, a difference of 0.48%).
| Demographics | Rating | Rank | Wage/Income Gap |
| Moroccans | 98.6 /100 | #105 | Exceptional 24.0% |
| Sudanese | 98.6 /100 | #106 | Exceptional 24.0% |
| Yaqui | 98.4 /100 | #107 | Exceptional 24.0% |
| Immigrants | Albania | 98.4 /100 | #108 | Exceptional 24.0% |
| Ugandans | 98.3 /100 | #109 | Exceptional 24.1% |
| Immigrants | Morocco | 98.1 /100 | #110 | Exceptional 24.1% |
| Soviet Union | 97.6 /100 | #111 | Exceptional 24.2% |
| Immigrants | Colombia | 97.0 /100 | #112 | Exceptional 24.3% |
| Sioux | 96.9 /100 | #113 | Exceptional 24.3% |
| Panamanians | 96.5 /100 | #114 | Exceptional 24.4% |
| Immigrants | Kenya | 96.4 /100 | #115 | Exceptional 24.4% |
| Alaska Natives | 96.0 /100 | #116 | Exceptional 24.4% |
| Immigrants | Afghanistan | 95.9 /100 | #117 | Exceptional 24.4% |
| Immigrants | Micronesia | 95.8 /100 | #118 | Exceptional 24.4% |
| Kenyans | 95.8 /100 | #119 | Exceptional 24.5% |