Welsh vs Puget Sound Salish Wage/Income Gap
COMPARE
Welsh
Puget Sound Salish
Wage/Income Gap
Wage/Income Gap Comparison
Welsh
Puget Sound Salish
28.9%
WAGE/INCOME GAP
0.1/ 100
METRIC RATING
321st/ 347
METRIC RANK
25.3%
WAGE/INCOME GAP
73.0/ 100
METRIC RATING
159th/ 347
METRIC RANK
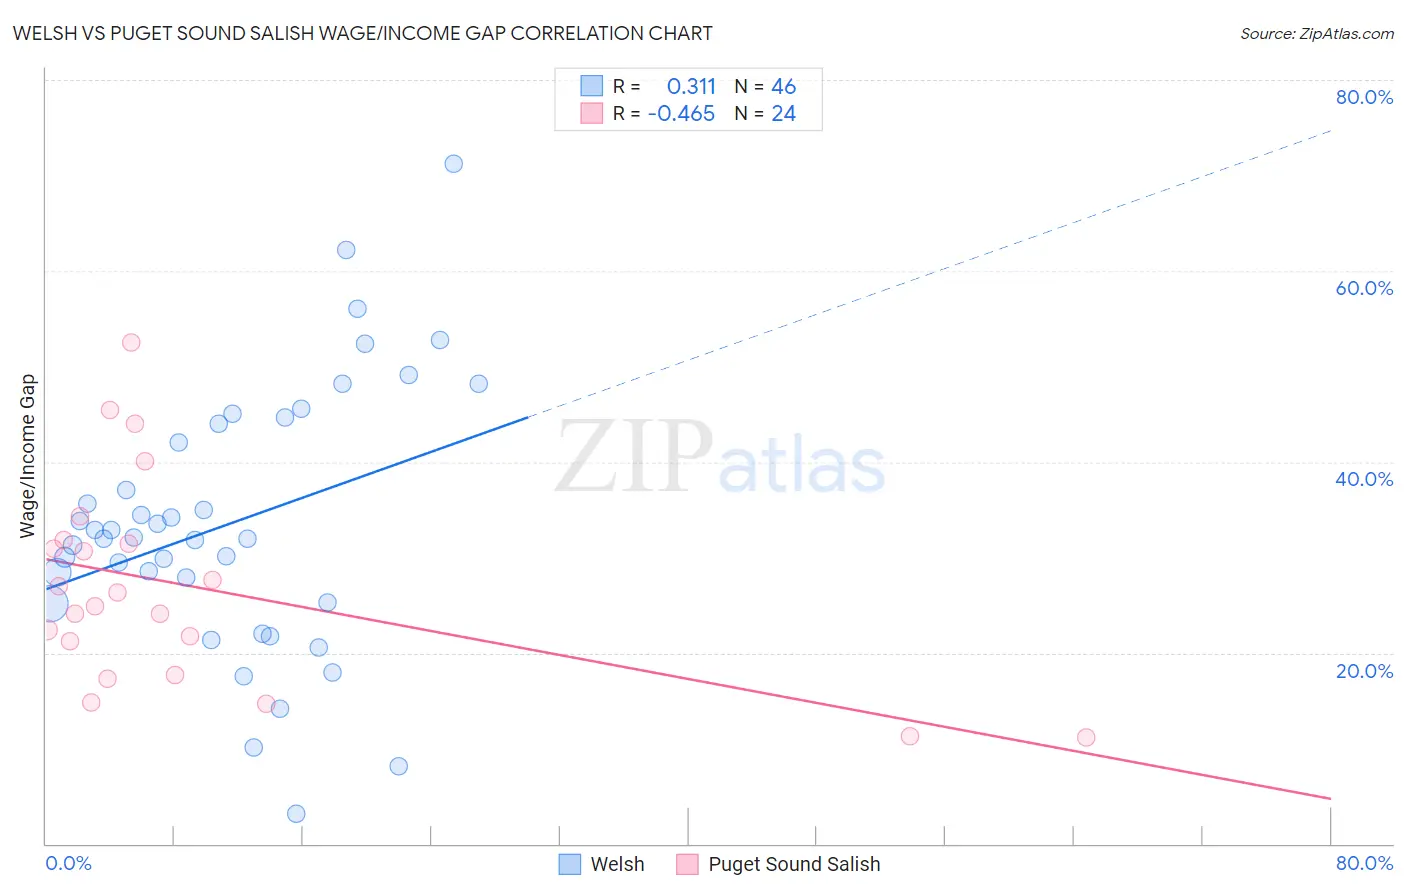
Welsh vs Puget Sound Salish Wage/Income Gap Correlation Chart
The statistical analysis conducted on geographies consisting of 527,078,541 people shows a mild positive correlation between the proportion of Welsh and wage/income gap percentage in the United States with a correlation coefficient (R) of 0.311 and weighted average of 28.9%. Similarly, the statistical analysis conducted on geographies consisting of 46,141,499 people shows a moderate negative correlation between the proportion of Puget Sound Salish and wage/income gap percentage in the United States with a correlation coefficient (R) of -0.465 and weighted average of 25.3%, a difference of 14.1%.
Wage/Income Gap Correlation Summary
| Measurement | Welsh | Puget Sound Salish |
| Minimum | 3.1% | 11.2% |
| Maximum | 71.2% | 52.5% |
| Range | 68.1% | 41.3% |
| Mean | 33.5% | 27.0% |
| Median | 32.1% | 25.6% |
| Interquartile 25% (IQ1) | 25.2% | 19.5% |
| Interquartile 75% (IQ3) | 44.0% | 31.7% |
| Interquartile Range (IQR) | 18.8% | 12.2% |
| Standard Deviation (Sample) | 13.8% | 10.7% |
| Standard Deviation (Population) | 13.7% | 10.5% |
Similar Demographics by Wage/Income Gap
Demographics Similar to Welsh by Wage/Income Gap
In terms of wage/income gap, the demographic groups most similar to Welsh are Immigrants from Singapore (28.9%, a difference of 0.020%), British (28.9%, a difference of 0.070%), Slovak (28.9%, a difference of 0.13%), Norwegian (29.0%, a difference of 0.13%), and Croatian (29.0%, a difference of 0.25%).
| Demographics | Rating | Rank | Wage/Income Gap |
| Immigrants | Scotland | 0.1 /100 | #314 | Tragic 28.7% |
| Maltese | 0.1 /100 | #315 | Tragic 28.7% |
| Lithuanians | 0.1 /100 | #316 | Tragic 28.7% |
| Belgians | 0.1 /100 | #317 | Tragic 28.8% |
| Basques | 0.1 /100 | #318 | Tragic 28.8% |
| Slovaks | 0.1 /100 | #319 | Tragic 28.9% |
| British | 0.1 /100 | #320 | Tragic 28.9% |
| Welsh | 0.1 /100 | #321 | Tragic 28.9% |
| Immigrants | Singapore | 0.1 /100 | #322 | Tragic 28.9% |
| Norwegians | 0.1 /100 | #323 | Tragic 29.0% |
| Croatians | 0.0 /100 | #324 | Tragic 29.0% |
| Hungarians | 0.0 /100 | #325 | Tragic 29.0% |
| Immigrants | Belgium | 0.0 /100 | #326 | Tragic 29.0% |
| Immigrants | Iran | 0.0 /100 | #327 | Tragic 29.1% |
| Scandinavians | 0.0 /100 | #328 | Tragic 29.1% |
Demographics Similar to Puget Sound Salish by Wage/Income Gap
In terms of wage/income gap, the demographic groups most similar to Puget Sound Salish are French American Indian (25.4%, a difference of 0.040%), Immigrants from Zimbabwe (25.3%, a difference of 0.060%), Costa Rican (25.3%, a difference of 0.24%), Albanian (25.4%, a difference of 0.29%), and Immigrants from Mexico (25.3%, a difference of 0.30%).
| Demographics | Rating | Rank | Wage/Income Gap |
| Uruguayans | 81.3 /100 | #152 | Excellent 25.2% |
| Blackfeet | 78.1 /100 | #153 | Good 25.2% |
| Immigrants | Northern Africa | 78.1 /100 | #154 | Good 25.2% |
| Immigrants | Vietnam | 77.7 /100 | #155 | Good 25.2% |
| Immigrants | Mexico | 76.4 /100 | #156 | Good 25.3% |
| Costa Ricans | 75.8 /100 | #157 | Good 25.3% |
| Immigrants | Zimbabwe | 73.7 /100 | #158 | Good 25.3% |
| Puget Sound Salish | 73.0 /100 | #159 | Good 25.3% |
| French American Indians | 72.5 /100 | #160 | Good 25.4% |
| Albanians | 69.4 /100 | #161 | Good 25.4% |
| Shoshone | 69.0 /100 | #162 | Good 25.4% |
| Native Hawaiians | 69.0 /100 | #163 | Good 25.4% |
| Koreans | 68.6 /100 | #164 | Good 25.4% |
| Immigrants | Hong Kong | 64.0 /100 | #165 | Good 25.5% |
| Immigrants | Ukraine | 63.8 /100 | #166 | Good 25.5% |