Immigrants from Korea vs Arapaho Wage/Income Gap
COMPARE
Immigrants from Korea
Arapaho
Wage/Income Gap
Wage/Income Gap Comparison
Immigrants from Korea
Arapaho
27.8%
WAGE/INCOME GAP
0.8/ 100
METRIC RATING
272nd/ 347
METRIC RANK
23.5%
WAGE/INCOME GAP
99.6/ 100
METRIC RATING
91st/ 347
METRIC RANK
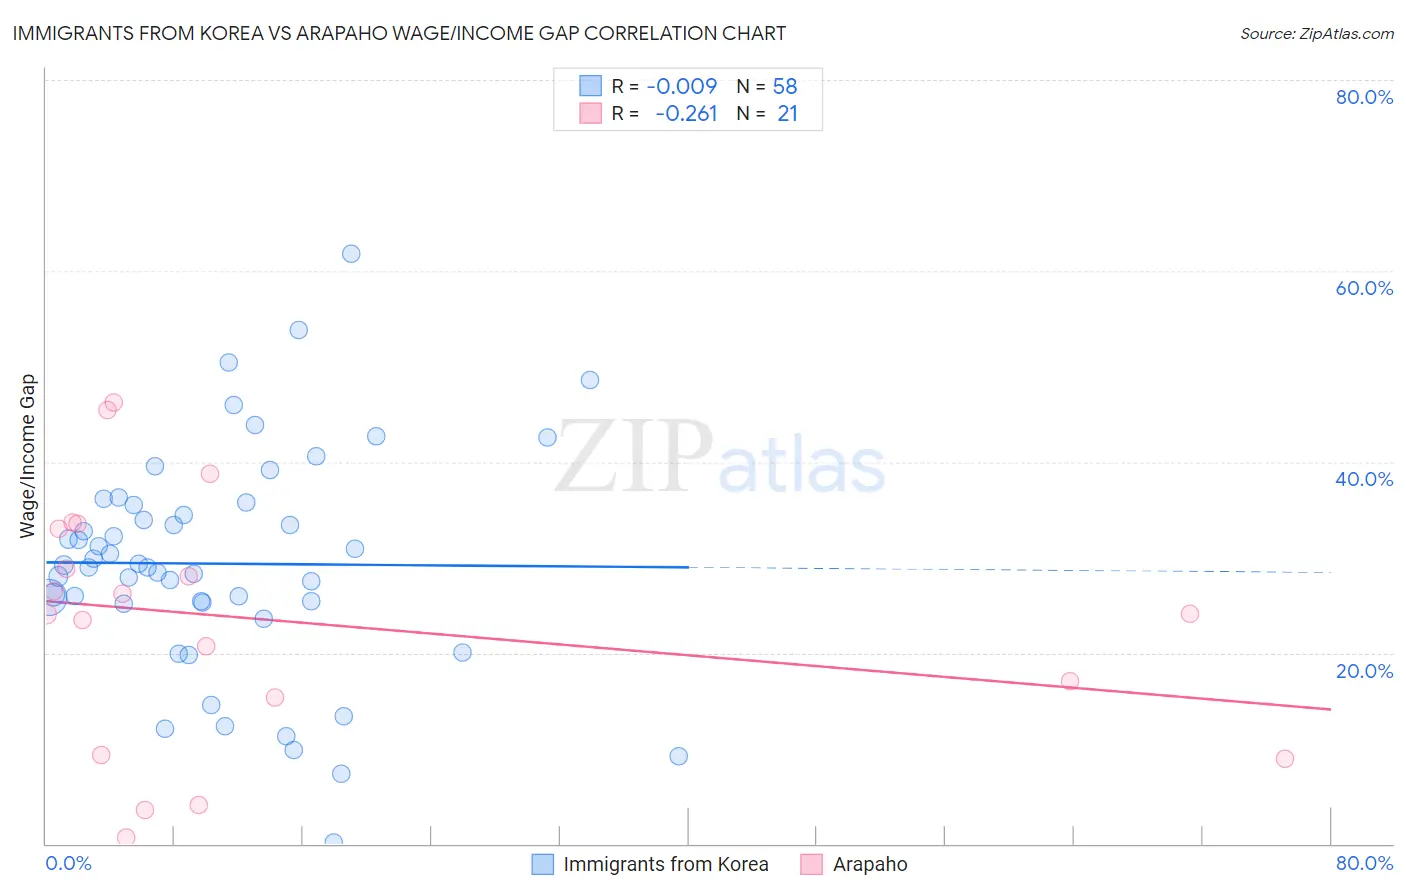
Immigrants from Korea vs Arapaho Wage/Income Gap Correlation Chart
The statistical analysis conducted on geographies consisting of 416,007,882 people shows no correlation between the proportion of Immigrants from Korea and wage/income gap percentage in the United States with a correlation coefficient (R) of -0.009 and weighted average of 27.8%. Similarly, the statistical analysis conducted on geographies consisting of 29,769,339 people shows a weak negative correlation between the proportion of Arapaho and wage/income gap percentage in the United States with a correlation coefficient (R) of -0.261 and weighted average of 23.5%, a difference of 18.5%.
Wage/Income Gap Correlation Summary
| Measurement | Immigrants from Korea | Arapaho |
| Minimum | 0.13% | 0.71% |
| Maximum | 61.8% | 46.3% |
| Range | 61.7% | 45.6% |
| Mean | 29.3% | 23.4% |
| Median | 29.1% | 24.1% |
| Interquartile 25% (IQ1) | 25.3% | 12.3% |
| Interquartile 75% (IQ3) | 35.5% | 33.3% |
| Interquartile Range (IQR) | 10.2% | 20.9% |
| Standard Deviation (Sample) | 11.7% | 13.1% |
| Standard Deviation (Population) | 11.6% | 12.8% |
Similar Demographics by Wage/Income Gap
Demographics Similar to Immigrants from Korea by Wage/Income Gap
In terms of wage/income gap, the demographic groups most similar to Immigrants from Korea are Ute (27.8%, a difference of 0.070%), Bulgarian (27.8%, a difference of 0.11%), Immigrants from Western Europe (27.8%, a difference of 0.15%), American (27.8%, a difference of 0.15%), and Immigrants from Japan (27.9%, a difference of 0.23%).
| Demographics | Rating | Rank | Wage/Income Gap |
| Serbians | 1.0 /100 | #265 | Tragic 27.7% |
| Hmong | 1.0 /100 | #266 | Tragic 27.7% |
| Turks | 1.0 /100 | #267 | Tragic 27.7% |
| New Zealanders | 1.0 /100 | #268 | Tragic 27.7% |
| Potawatomi | 0.9 /100 | #269 | Tragic 27.7% |
| Immigrants | Western Europe | 0.9 /100 | #270 | Tragic 27.8% |
| Ute | 0.8 /100 | #271 | Tragic 27.8% |
| Immigrants | Korea | 0.8 /100 | #272 | Tragic 27.8% |
| Bulgarians | 0.7 /100 | #273 | Tragic 27.8% |
| Americans | 0.7 /100 | #274 | Tragic 27.8% |
| Immigrants | Japan | 0.7 /100 | #275 | Tragic 27.9% |
| Lebanese | 0.7 /100 | #276 | Tragic 27.9% |
| Latvians | 0.7 /100 | #277 | Tragic 27.9% |
| Immigrants | England | 0.6 /100 | #278 | Tragic 27.9% |
| Romanians | 0.5 /100 | #279 | Tragic 28.0% |
Demographics Similar to Arapaho by Wage/Income Gap
In terms of wage/income gap, the demographic groups most similar to Arapaho are Nicaraguan (23.4%, a difference of 0.14%), Marshallese (23.4%, a difference of 0.15%), Immigrants from Honduras (23.5%, a difference of 0.15%), Immigrants from Panama (23.4%, a difference of 0.24%), and Immigrants from Cabo Verde (23.6%, a difference of 0.39%).
| Demographics | Rating | Rank | Wage/Income Gap |
| Cubans | 99.7 /100 | #84 | Exceptional 23.3% |
| Immigrants | Cambodia | 99.7 /100 | #85 | Exceptional 23.3% |
| Cheyenne | 99.7 /100 | #86 | Exceptional 23.3% |
| Yuman | 99.7 /100 | #87 | Exceptional 23.3% |
| Immigrants | Panama | 99.6 /100 | #88 | Exceptional 23.4% |
| Marshallese | 99.6 /100 | #89 | Exceptional 23.4% |
| Nicaraguans | 99.6 /100 | #90 | Exceptional 23.4% |
| Arapaho | 99.6 /100 | #91 | Exceptional 23.5% |
| Immigrants | Honduras | 99.5 /100 | #92 | Exceptional 23.5% |
| Immigrants | Cabo Verde | 99.5 /100 | #93 | Exceptional 23.6% |
| Hondurans | 99.5 /100 | #94 | Exceptional 23.6% |
| Cape Verdeans | 99.4 /100 | #95 | Exceptional 23.6% |
| Kiowa | 99.4 /100 | #96 | Exceptional 23.6% |
| Immigrants | Sudan | 99.4 /100 | #97 | Exceptional 23.6% |
| Immigrants | Latin America | 99.2 /100 | #98 | Exceptional 23.7% |