Immigrants from Korea vs Immigrants from Bangladesh Wage/Income Gap
COMPARE
Immigrants from Korea
Immigrants from Bangladesh
Wage/Income Gap
Wage/Income Gap Comparison
Immigrants from Korea
Immigrants from Bangladesh
27.8%
WAGE/INCOME GAP
0.8/ 100
METRIC RATING
272nd/ 347
METRIC RANK
20.9%
WAGE/INCOME GAP
100.0/ 100
METRIC RATING
30th/ 347
METRIC RANK
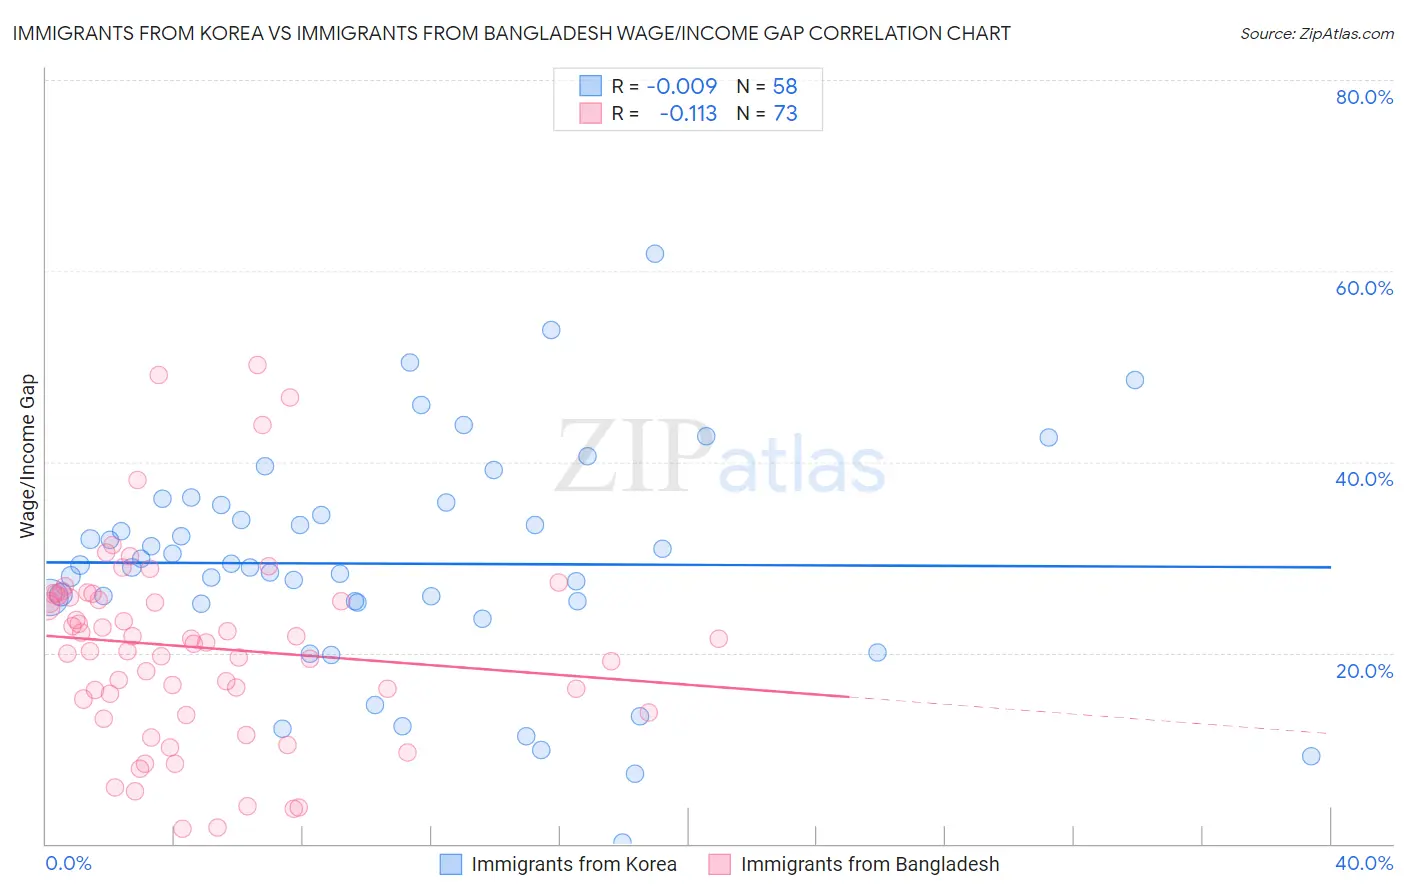
Immigrants from Korea vs Immigrants from Bangladesh Wage/Income Gap Correlation Chart
The statistical analysis conducted on geographies consisting of 416,007,882 people shows no correlation between the proportion of Immigrants from Korea and wage/income gap percentage in the United States with a correlation coefficient (R) of -0.009 and weighted average of 27.8%. Similarly, the statistical analysis conducted on geographies consisting of 203,640,162 people shows a poor negative correlation between the proportion of Immigrants from Bangladesh and wage/income gap percentage in the United States with a correlation coefficient (R) of -0.113 and weighted average of 20.9%, a difference of 32.7%.
Wage/Income Gap Correlation Summary
| Measurement | Immigrants from Korea | Immigrants from Bangladesh |
| Minimum | 0.13% | 1.6% |
| Maximum | 61.8% | 50.1% |
| Range | 61.7% | 48.5% |
| Mean | 29.3% | 20.6% |
| Median | 29.1% | 21.1% |
| Interquartile 25% (IQ1) | 25.3% | 14.5% |
| Interquartile 75% (IQ3) | 35.5% | 26.1% |
| Interquartile Range (IQR) | 10.2% | 11.6% |
| Standard Deviation (Sample) | 11.7% | 10.2% |
| Standard Deviation (Population) | 11.6% | 10.1% |
Similar Demographics by Wage/Income Gap
Demographics Similar to Immigrants from Korea by Wage/Income Gap
In terms of wage/income gap, the demographic groups most similar to Immigrants from Korea are Ute (27.8%, a difference of 0.070%), Bulgarian (27.8%, a difference of 0.11%), Immigrants from Western Europe (27.8%, a difference of 0.15%), American (27.8%, a difference of 0.15%), and Immigrants from Japan (27.9%, a difference of 0.23%).
| Demographics | Rating | Rank | Wage/Income Gap |
| Serbians | 1.0 /100 | #265 | Tragic 27.7% |
| Hmong | 1.0 /100 | #266 | Tragic 27.7% |
| Turks | 1.0 /100 | #267 | Tragic 27.7% |
| New Zealanders | 1.0 /100 | #268 | Tragic 27.7% |
| Potawatomi | 0.9 /100 | #269 | Tragic 27.7% |
| Immigrants | Western Europe | 0.9 /100 | #270 | Tragic 27.8% |
| Ute | 0.8 /100 | #271 | Tragic 27.8% |
| Immigrants | Korea | 0.8 /100 | #272 | Tragic 27.8% |
| Bulgarians | 0.7 /100 | #273 | Tragic 27.8% |
| Americans | 0.7 /100 | #274 | Tragic 27.8% |
| Immigrants | Japan | 0.7 /100 | #275 | Tragic 27.9% |
| Lebanese | 0.7 /100 | #276 | Tragic 27.9% |
| Latvians | 0.7 /100 | #277 | Tragic 27.9% |
| Immigrants | England | 0.6 /100 | #278 | Tragic 27.9% |
| Romanians | 0.5 /100 | #279 | Tragic 28.0% |
Demographics Similar to Immigrants from Bangladesh by Wage/Income Gap
In terms of wage/income gap, the demographic groups most similar to Immigrants from Bangladesh are Immigrants from Senegal (20.9%, a difference of 0.21%), Vietnamese (21.0%, a difference of 0.28%), Immigrants from Yemen (21.1%, a difference of 0.51%), Immigrants from Bahamas (21.1%, a difference of 0.53%), and Pima (21.1%, a difference of 0.81%).
| Demographics | Rating | Rank | Wage/Income Gap |
| Immigrants | Dominican Republic | 100.0 /100 | #23 | Exceptional 20.6% |
| Dominicans | 100.0 /100 | #24 | Exceptional 20.6% |
| Senegalese | 100.0 /100 | #25 | Exceptional 20.7% |
| Pueblo | 100.0 /100 | #26 | Exceptional 20.7% |
| Immigrants | Armenia | 100.0 /100 | #27 | Exceptional 20.7% |
| Inupiat | 100.0 /100 | #28 | Exceptional 20.8% |
| Immigrants | Senegal | 100.0 /100 | #29 | Exceptional 20.9% |
| Immigrants | Bangladesh | 100.0 /100 | #30 | Exceptional 20.9% |
| Vietnamese | 100.0 /100 | #31 | Exceptional 21.0% |
| Immigrants | Yemen | 100.0 /100 | #32 | Exceptional 21.1% |
| Immigrants | Bahamas | 100.0 /100 | #33 | Exceptional 21.1% |
| Pima | 100.0 /100 | #34 | Exceptional 21.1% |
| Somalis | 100.0 /100 | #35 | Exceptional 21.2% |
| Belizeans | 100.0 /100 | #36 | Exceptional 21.2% |
| Immigrants | Somalia | 100.0 /100 | #37 | Exceptional 21.2% |