Immigrants from Korea vs Ethiopian Wage/Income Gap
COMPARE
Immigrants from Korea
Ethiopian
Wage/Income Gap
Wage/Income Gap Comparison
Immigrants from Korea
Ethiopians
27.8%
WAGE/INCOME GAP
0.8/ 100
METRIC RATING
272nd/ 347
METRIC RANK
21.8%
WAGE/INCOME GAP
100.0/ 100
METRIC RATING
49th/ 347
METRIC RANK
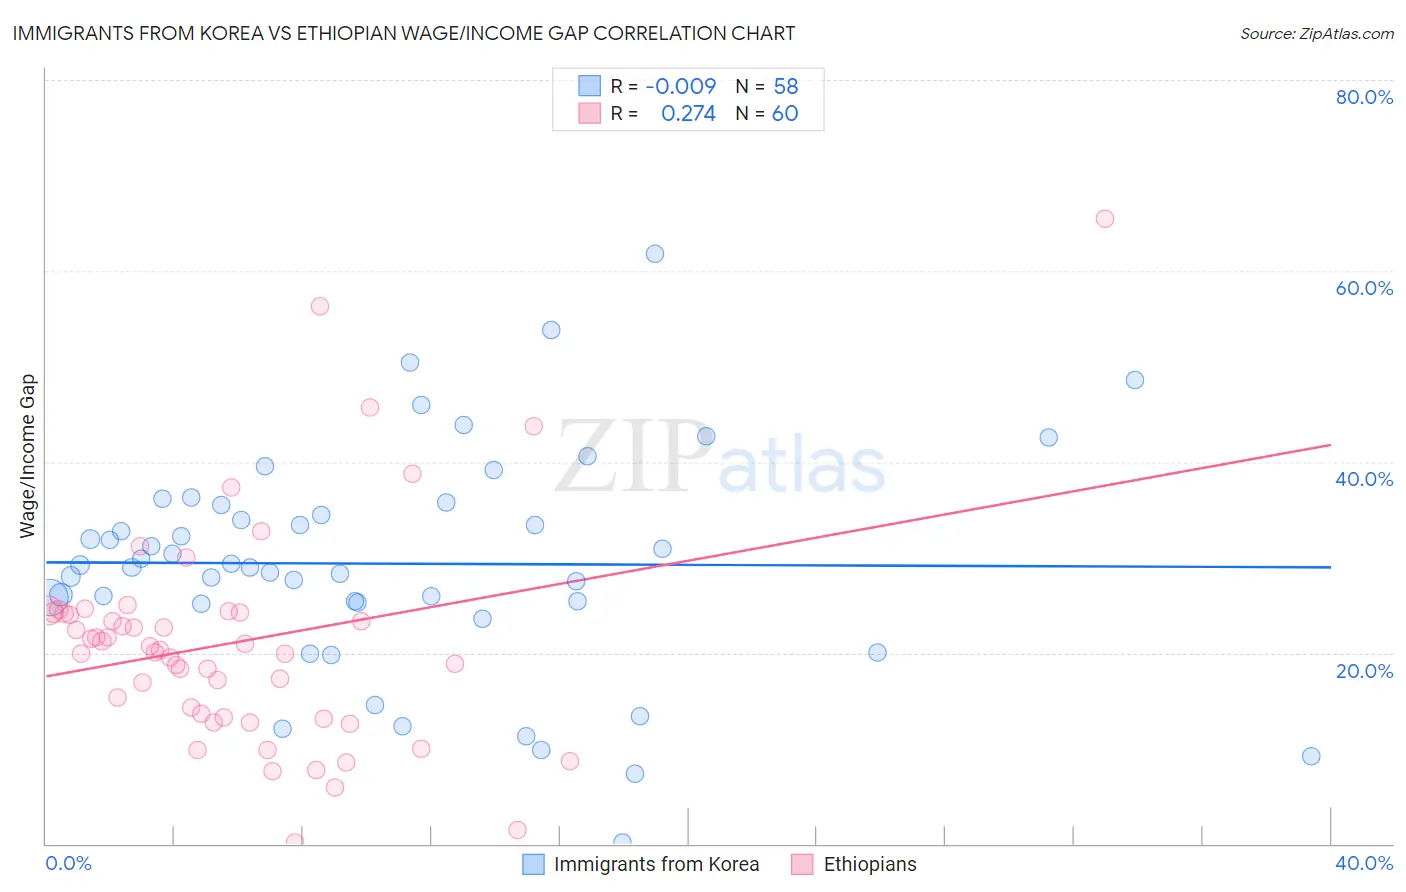
Immigrants from Korea vs Ethiopian Wage/Income Gap Correlation Chart
The statistical analysis conducted on geographies consisting of 416,007,882 people shows no correlation between the proportion of Immigrants from Korea and wage/income gap percentage in the United States with a correlation coefficient (R) of -0.009 and weighted average of 27.8%. Similarly, the statistical analysis conducted on geographies consisting of 223,211,897 people shows a weak positive correlation between the proportion of Ethiopians and wage/income gap percentage in the United States with a correlation coefficient (R) of 0.274 and weighted average of 21.8%, a difference of 27.3%.
Wage/Income Gap Correlation Summary
| Measurement | Immigrants from Korea | Ethiopian |
| Minimum | 0.13% | 0.11% |
| Maximum | 61.8% | 65.4% |
| Range | 61.7% | 65.3% |
| Mean | 29.3% | 21.1% |
| Median | 29.1% | 20.5% |
| Interquartile 25% (IQ1) | 25.3% | 13.4% |
| Interquartile 75% (IQ3) | 35.5% | 24.2% |
| Interquartile Range (IQR) | 10.2% | 10.8% |
| Standard Deviation (Sample) | 11.7% | 11.6% |
| Standard Deviation (Population) | 11.6% | 11.5% |
Similar Demographics by Wage/Income Gap
Demographics Similar to Immigrants from Korea by Wage/Income Gap
In terms of wage/income gap, the demographic groups most similar to Immigrants from Korea are Ute (27.8%, a difference of 0.070%), Bulgarian (27.8%, a difference of 0.11%), Immigrants from Western Europe (27.8%, a difference of 0.15%), American (27.8%, a difference of 0.15%), and Immigrants from Japan (27.9%, a difference of 0.23%).
| Demographics | Rating | Rank | Wage/Income Gap |
| Serbians | 1.0 /100 | #265 | Tragic 27.7% |
| Hmong | 1.0 /100 | #266 | Tragic 27.7% |
| Turks | 1.0 /100 | #267 | Tragic 27.7% |
| New Zealanders | 1.0 /100 | #268 | Tragic 27.7% |
| Potawatomi | 0.9 /100 | #269 | Tragic 27.7% |
| Immigrants | Western Europe | 0.9 /100 | #270 | Tragic 27.8% |
| Ute | 0.8 /100 | #271 | Tragic 27.8% |
| Immigrants | Korea | 0.8 /100 | #272 | Tragic 27.8% |
| Bulgarians | 0.7 /100 | #273 | Tragic 27.8% |
| Americans | 0.7 /100 | #274 | Tragic 27.8% |
| Immigrants | Japan | 0.7 /100 | #275 | Tragic 27.9% |
| Lebanese | 0.7 /100 | #276 | Tragic 27.9% |
| Latvians | 0.7 /100 | #277 | Tragic 27.9% |
| Immigrants | England | 0.6 /100 | #278 | Tragic 27.9% |
| Romanians | 0.5 /100 | #279 | Tragic 28.0% |
Demographics Similar to Ethiopians by Wage/Income Gap
In terms of wage/income gap, the demographic groups most similar to Ethiopians are Black/African American (21.7%, a difference of 0.51%), Immigrants from Congo (21.7%, a difference of 0.69%), Immigrants from Western Africa (22.0%, a difference of 0.98%), Immigrants from Ethiopia (21.6%, a difference of 1.3%), and U.S. Virgin Islander (21.5%, a difference of 1.4%).
| Demographics | Rating | Rank | Wage/Income Gap |
| Immigrants | Sierra Leone | 100.0 /100 | #42 | Exceptional 21.4% |
| Sierra Leoneans | 100.0 /100 | #43 | Exceptional 21.4% |
| Immigrants | Eritrea | 100.0 /100 | #44 | Exceptional 21.4% |
| U.S. Virgin Islanders | 100.0 /100 | #45 | Exceptional 21.5% |
| Immigrants | Ethiopia | 100.0 /100 | #46 | Exceptional 21.6% |
| Immigrants | Congo | 100.0 /100 | #47 | Exceptional 21.7% |
| Blacks/African Americans | 100.0 /100 | #48 | Exceptional 21.7% |
| Ethiopians | 100.0 /100 | #49 | Exceptional 21.8% |
| Immigrants | Western Africa | 100.0 /100 | #50 | Exceptional 22.0% |
| Tohono O'odham | 100.0 /100 | #51 | Exceptional 22.1% |
| Immigrants | Cameroon | 100.0 /100 | #52 | Exceptional 22.2% |
| Bangladeshis | 100.0 /100 | #53 | Exceptional 22.2% |
| Nepalese | 100.0 /100 | #54 | Exceptional 22.2% |
| Immigrants | Zaire | 100.0 /100 | #55 | Exceptional 22.3% |
| Immigrants | Ghana | 100.0 /100 | #56 | Exceptional 22.3% |