Scotch-Irish vs Okinawan Householder Income Over 65 years
COMPARE
Scotch-Irish
Okinawan
Householder Income Over 65 years
Householder Income Over 65 years Comparison
Scotch-Irish
Okinawans
$59,447
HOUSEHOLDER INCOME OVER 65 YEARS
16.9/ 100
METRIC RATING
203rd/ 347
METRIC RANK
$70,846
HOUSEHOLDER INCOME OVER 65 YEARS
100.0/ 100
METRIC RATING
16th/ 347
METRIC RANK
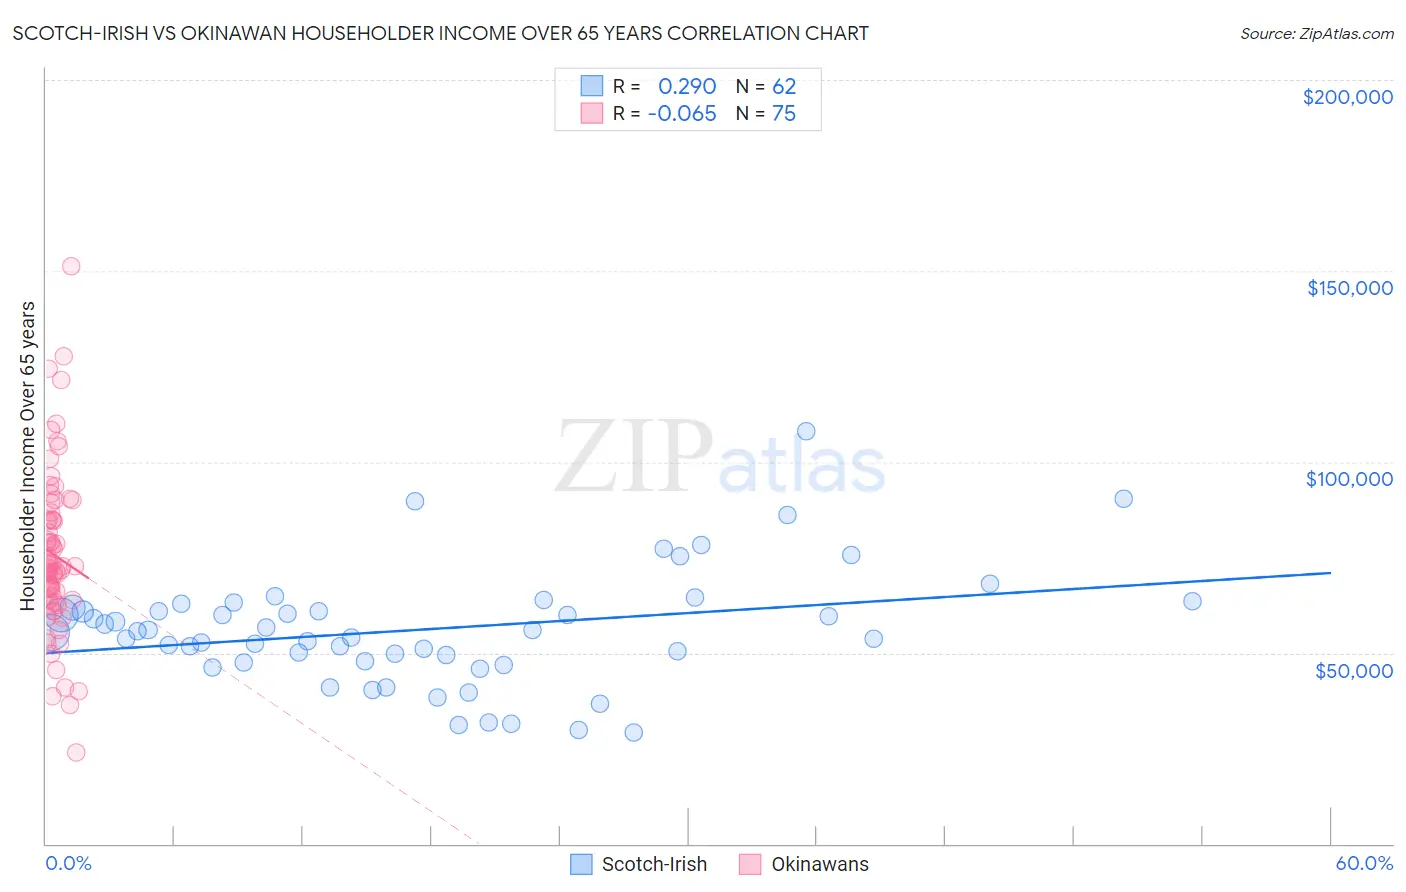
Scotch-Irish vs Okinawan Householder Income Over 65 years Correlation Chart
The statistical analysis conducted on geographies consisting of 544,677,827 people shows a weak positive correlation between the proportion of Scotch-Irish and household income with householder over the age of 65 in the United States with a correlation coefficient (R) of 0.290 and weighted average of $59,447. Similarly, the statistical analysis conducted on geographies consisting of 73,674,458 people shows a slight negative correlation between the proportion of Okinawans and household income with householder over the age of 65 in the United States with a correlation coefficient (R) of -0.065 and weighted average of $70,846, a difference of 19.2%.
Householder Income Over 65 years Correlation Summary
| Measurement | Scotch-Irish | Okinawan |
| Minimum | $29,123 | $24,013 |
| Maximum | $108,125 | $151,316 |
| Range | $79,002 | $127,303 |
| Mean | $56,120 | $75,534 |
| Median | $55,574 | $72,378 |
| Interquartile 25% (IQ1) | $47,845 | $63,808 |
| Interquartile 75% (IQ3) | $61,936 | $84,880 |
| Interquartile Range (IQR) | $14,091 | $21,072 |
| Standard Deviation (Sample) | $15,113 | $21,585 |
| Standard Deviation (Population) | $14,991 | $21,441 |
Similar Demographics by Householder Income Over 65 years
Demographics Similar to Scotch-Irish by Householder Income Over 65 years
In terms of householder income over 65 years, the demographic groups most similar to Scotch-Irish are Arapaho ($59,383, a difference of 0.11%), Dutch ($59,539, a difference of 0.15%), Finnish ($59,535, a difference of 0.15%), Immigrants from Sudan ($59,248, a difference of 0.34%), and Immigrants ($59,656, a difference of 0.35%).
| Demographics | Rating | Rank | Householder Income Over 65 years |
| Germans | 21.5 /100 | #196 | Fair $59,730 |
| Immigrants | Kenya | 21.1 /100 | #197 | Fair $59,710 |
| Moroccans | 20.7 /100 | #198 | Fair $59,683 |
| Immigrants | Immigrants | 20.2 /100 | #199 | Fair $59,656 |
| French | 20.2 /100 | #200 | Fair $59,656 |
| Dutch | 18.3 /100 | #201 | Poor $59,539 |
| Finns | 18.2 /100 | #202 | Poor $59,535 |
| Scotch-Irish | 16.9 /100 | #203 | Poor $59,447 |
| Arapaho | 16.0 /100 | #204 | Poor $59,383 |
| Immigrants | Sudan | 14.2 /100 | #205 | Poor $59,248 |
| Immigrants | South America | 13.0 /100 | #206 | Poor $59,151 |
| Salvadorans | 12.9 /100 | #207 | Poor $59,141 |
| Uruguayans | 12.3 /100 | #208 | Poor $59,090 |
| Slovaks | 11.7 /100 | #209 | Poor $59,039 |
| Nigerians | 11.2 /100 | #210 | Poor $58,992 |
Demographics Similar to Okinawans by Householder Income Over 65 years
In terms of householder income over 65 years, the demographic groups most similar to Okinawans are Immigrants from Korea ($70,696, a difference of 0.21%), Native Hawaiian ($71,021, a difference of 0.25%), Burmese ($71,139, a difference of 0.41%), Eastern European ($70,470, a difference of 0.53%), and Indian (Asian) ($70,238, a difference of 0.87%).
| Demographics | Rating | Rank | Householder Income Over 65 years |
| Immigrants | India | 100.0 /100 | #9 | Exceptional $72,804 |
| Bhutanese | 100.0 /100 | #10 | Exceptional $72,288 |
| Thais | 100.0 /100 | #11 | Exceptional $72,099 |
| Cypriots | 100.0 /100 | #12 | Exceptional $71,714 |
| Immigrants | Hong Kong | 100.0 /100 | #13 | Exceptional $71,567 |
| Burmese | 100.0 /100 | #14 | Exceptional $71,139 |
| Native Hawaiians | 100.0 /100 | #15 | Exceptional $71,021 |
| Okinawans | 100.0 /100 | #16 | Exceptional $70,846 |
| Immigrants | Korea | 100.0 /100 | #17 | Exceptional $70,696 |
| Eastern Europeans | 100.0 /100 | #18 | Exceptional $70,470 |
| Indians (Asian) | 100.0 /100 | #19 | Exceptional $70,238 |
| Immigrants | South Central Asia | 100.0 /100 | #20 | Exceptional $70,103 |
| Immigrants | Eastern Asia | 100.0 /100 | #21 | Exceptional $69,872 |
| Immigrants | Israel | 100.0 /100 | #22 | Exceptional $69,857 |
| Immigrants | Japan | 100.0 /100 | #23 | Exceptional $69,774 |