Laotian vs Okinawan Householder Income Over 65 years
COMPARE
Laotian
Okinawan
Householder Income Over 65 years
Householder Income Over 65 years Comparison
Laotians
Okinawans
$66,306
HOUSEHOLDER INCOME OVER 65 YEARS
99.6/ 100
METRIC RATING
56th/ 347
METRIC RANK
$70,846
HOUSEHOLDER INCOME OVER 65 YEARS
100.0/ 100
METRIC RATING
16th/ 347
METRIC RANK
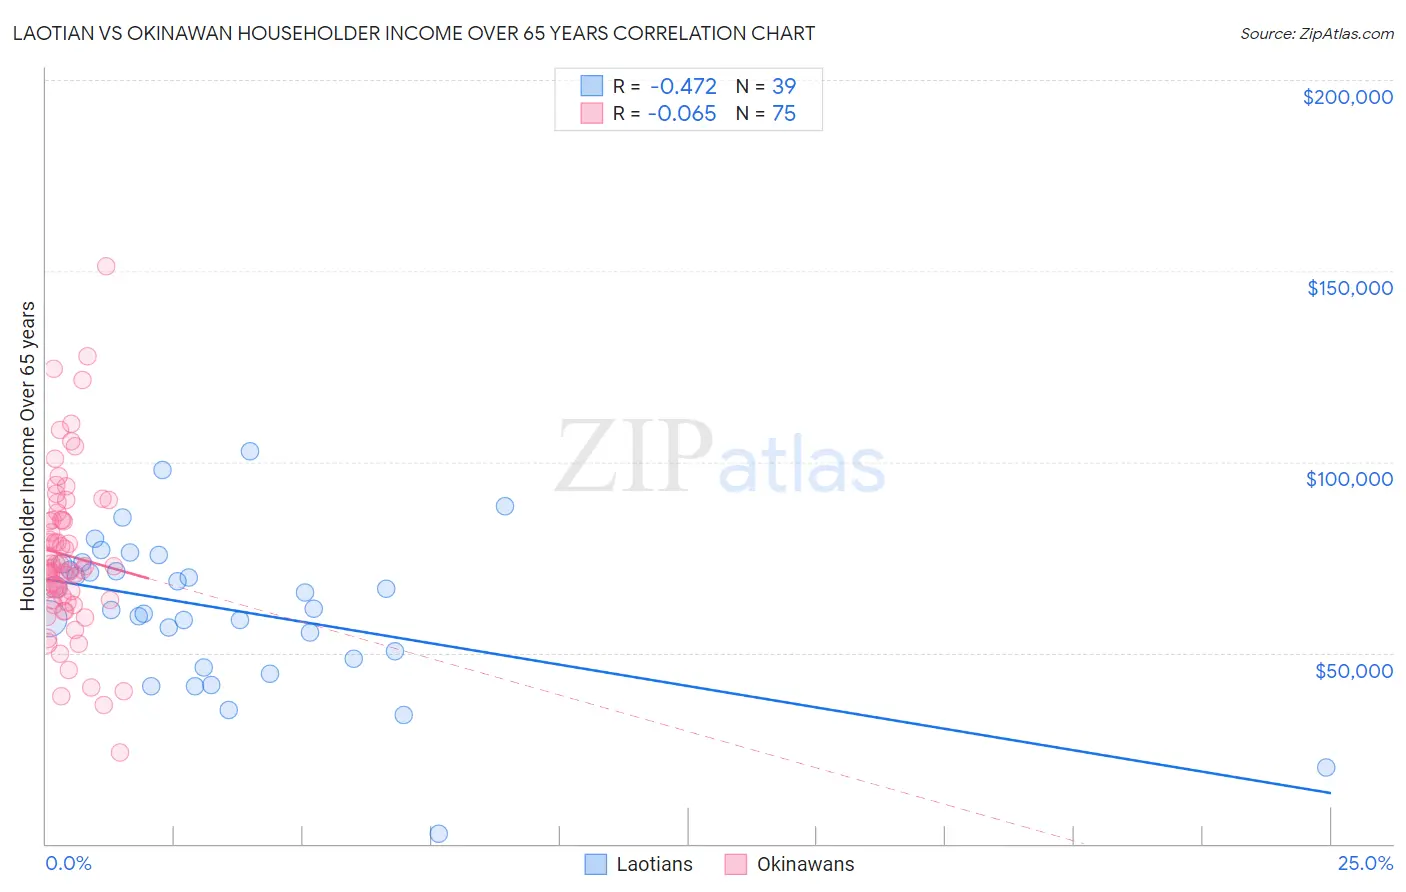
Laotian vs Okinawan Householder Income Over 65 years Correlation Chart
The statistical analysis conducted on geographies consisting of 224,427,715 people shows a moderate negative correlation between the proportion of Laotians and household income with householder over the age of 65 in the United States with a correlation coefficient (R) of -0.472 and weighted average of $66,306. Similarly, the statistical analysis conducted on geographies consisting of 73,674,458 people shows a slight negative correlation between the proportion of Okinawans and household income with householder over the age of 65 in the United States with a correlation coefficient (R) of -0.065 and weighted average of $70,846, a difference of 6.9%.
Householder Income Over 65 years Correlation Summary
| Measurement | Laotian | Okinawan |
| Minimum | $2,499 | $24,013 |
| Maximum | $102,679 | $151,316 |
| Range | $100,180 | $127,303 |
| Mean | $61,254 | $75,534 |
| Median | $61,648 | $72,378 |
| Interquartile 25% (IQ1) | $48,484 | $63,808 |
| Interquartile 75% (IQ3) | $73,311 | $84,880 |
| Interquartile Range (IQR) | $24,827 | $21,072 |
| Standard Deviation (Sample) | $19,839 | $21,585 |
| Standard Deviation (Population) | $19,583 | $21,441 |
Similar Demographics by Householder Income Over 65 years
Demographics Similar to Laotians by Householder Income Over 65 years
In terms of householder income over 65 years, the demographic groups most similar to Laotians are Immigrants from Czechoslovakia ($66,376, a difference of 0.11%), Bulgarian ($66,236, a difference of 0.11%), Immigrants from Philippines ($66,161, a difference of 0.22%), Immigrants from Netherlands ($66,463, a difference of 0.24%), and Immigrants from Norway ($66,118, a difference of 0.28%).
| Demographics | Rating | Rank | Householder Income Over 65 years |
| Immigrants | Indonesia | 99.8 /100 | #49 | Exceptional $66,694 |
| Immigrants | Turkey | 99.7 /100 | #50 | Exceptional $66,672 |
| Israelis | 99.7 /100 | #51 | Exceptional $66,636 |
| Immigrants | Scotland | 99.7 /100 | #52 | Exceptional $66,620 |
| Immigrants | Pakistan | 99.7 /100 | #53 | Exceptional $66,617 |
| Immigrants | Netherlands | 99.7 /100 | #54 | Exceptional $66,463 |
| Immigrants | Czechoslovakia | 99.7 /100 | #55 | Exceptional $66,376 |
| Laotians | 99.6 /100 | #56 | Exceptional $66,306 |
| Bulgarians | 99.6 /100 | #57 | Exceptional $66,236 |
| Immigrants | Philippines | 99.6 /100 | #58 | Exceptional $66,161 |
| Immigrants | Norway | 99.5 /100 | #59 | Exceptional $66,118 |
| Immigrants | Lithuania | 99.5 /100 | #60 | Exceptional $66,087 |
| Maltese | 99.5 /100 | #61 | Exceptional $66,027 |
| Immigrants | Sierra Leone | 99.5 /100 | #62 | Exceptional $66,009 |
| Marshallese | 99.4 /100 | #63 | Exceptional $65,874 |
Demographics Similar to Okinawans by Householder Income Over 65 years
In terms of householder income over 65 years, the demographic groups most similar to Okinawans are Immigrants from Korea ($70,696, a difference of 0.21%), Native Hawaiian ($71,021, a difference of 0.25%), Burmese ($71,139, a difference of 0.41%), Eastern European ($70,470, a difference of 0.53%), and Indian (Asian) ($70,238, a difference of 0.87%).
| Demographics | Rating | Rank | Householder Income Over 65 years |
| Immigrants | India | 100.0 /100 | #9 | Exceptional $72,804 |
| Bhutanese | 100.0 /100 | #10 | Exceptional $72,288 |
| Thais | 100.0 /100 | #11 | Exceptional $72,099 |
| Cypriots | 100.0 /100 | #12 | Exceptional $71,714 |
| Immigrants | Hong Kong | 100.0 /100 | #13 | Exceptional $71,567 |
| Burmese | 100.0 /100 | #14 | Exceptional $71,139 |
| Native Hawaiians | 100.0 /100 | #15 | Exceptional $71,021 |
| Okinawans | 100.0 /100 | #16 | Exceptional $70,846 |
| Immigrants | Korea | 100.0 /100 | #17 | Exceptional $70,696 |
| Eastern Europeans | 100.0 /100 | #18 | Exceptional $70,470 |
| Indians (Asian) | 100.0 /100 | #19 | Exceptional $70,238 |
| Immigrants | South Central Asia | 100.0 /100 | #20 | Exceptional $70,103 |
| Immigrants | Eastern Asia | 100.0 /100 | #21 | Exceptional $69,872 |
| Immigrants | Israel | 100.0 /100 | #22 | Exceptional $69,857 |
| Immigrants | Japan | 100.0 /100 | #23 | Exceptional $69,774 |